


US Dollar Price Action Talking Points:
This is a walk-through of the charts being discussed during the live price action webinar. Upon conclusion of the webinar, the archive will be available from the video box above. Below are charts of markets to be addressed during this session.
US Dollar Grasps for Support at 96.00 Handle
It’s been a brutal month of June so far for the Greenback. The currency had come into the month clinging to a bullish theme that had started last February. The Q2 open presented an ascending triangle formation, which will often be approached for bullish breakouts. That bullish breakout took place in April and again in May, but in both instances, buyers were met with resistance at the 98.33 area on the chart; helping to create another candlestick formation, but this time pointing south. A rising wedge will often be approached with the aim of bearish reversals, and the short-side of that formation has already given way on the heels of last week’s FOMC rate decision.
At this point, USD appears oversold, and a prior zone of support remains as resistance potential around the confluent price of 96.47.
US Dollar Daily Price Chart

Chart prepared by James Stanley
EURUSD Rally Gets Caught at 1.1400 – Top or Not?
Perhaps most surprising from last week was the topside ramp in EURUSD. While Mario Draghi echoed a familiar dovish tone in a speech last week, this was more than offset by the dovish flip at the Fed. And perhaps more importantly, the short-side move in EURUSD has been rather pronounced since last year, leading to a longer-term oversold situation that was ripe for a short-squeeze scenario. That’s likely the primary culprit behind the move, but there may be more room yet for it to go.
At this stage, resistance is showing off of the 1.1400 handle. The big question is whether buyers return to offer higher-low support around the prior group of swing highs in the 1.1325-1.1350 area.
EURUSD Daily Price Chart
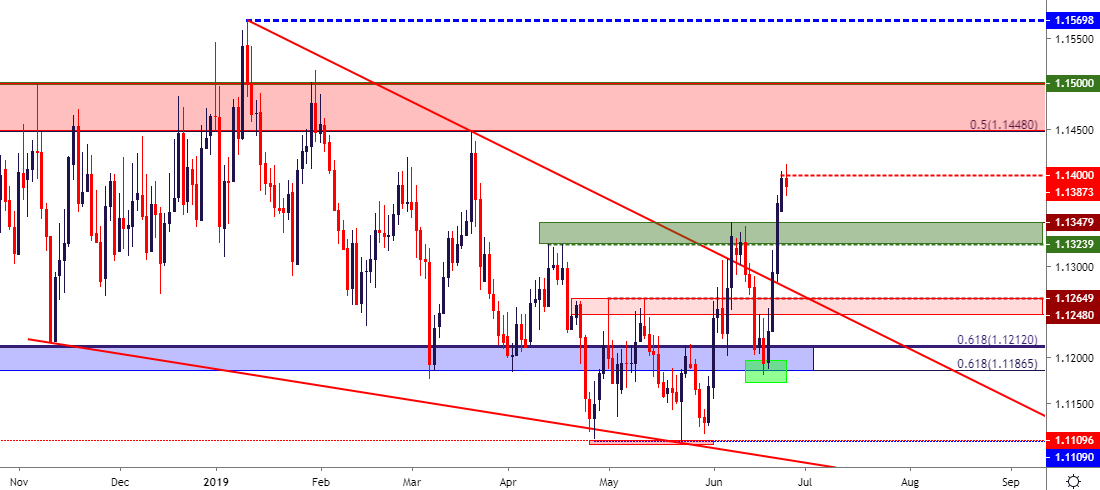
Chart prepared by James Stanley
GBPUSD Support Bounce Runs into 2750 Resistance
Last week saw a similar move of strength in GBPUSD, however this was a bit tamer than what had shown in EURUSD above. In GBPUSD, a long-term Fibonacci level and a trend-line projection came into play to help hold the lows. But, the corresponding advance has been met with sellers at the 2750 psychological level. A close today below the 1.2705 level keeps the door open for short-side strategies, looking to strike on a bearish engulfing candlestick on the daily chart.
GBPUSD Daily Price Chart

Chart prepared by James Stanley
USDJPY Crosses 107: Time for a Bounce?
I’ve been following the short-side of USDJPY for over a month now, looking to the pair for themes of USD-weakness with the added potential of additional Yen-strength on the back of risk aversion flows. The risk aversion flows haven’t really shown-up, but USD-weakness certainly has. The target at 107 was crossed earlier today, but the pair has oversold tonalities and may soon be due for a bounce. This places emphasis on the prior support level around 108.00 for lower-high resistance potential.
USDJPY Eight-Hour Price Chart
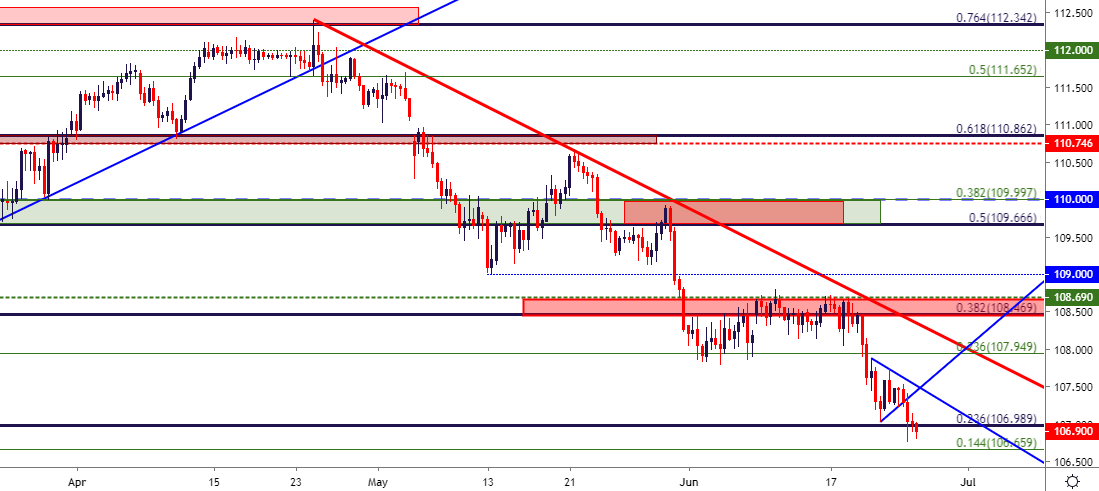
Chart prepared by James Stanley
USDCAD Retains Attractiveness for Short-Side USD Themes
Last week also brought a big inflation print out of Canada ahead of that FOMC rate decision. This added a bit of CAD-strength to go along with that USD-weakness, allowing for USDCAD to fall out of the bottom of a longer-term symmetrical wedge pattern.
USDCAD Weekly Price Chart

Chart prepared by James Stanley
This can keep the door open for short-side breakout appeal for themes around a continuation of USD-weakness. A Fibonacci level lurks below around the 1.3132 area on the chart, and a push below that opens the door for a test of the level at 1.3066. Alternatively, a pullback to the prior support zone that ran from 1.3250-1.3300 can open the door for short-side trend strategies in USDCAD.
USDCAD Daily Price Chart
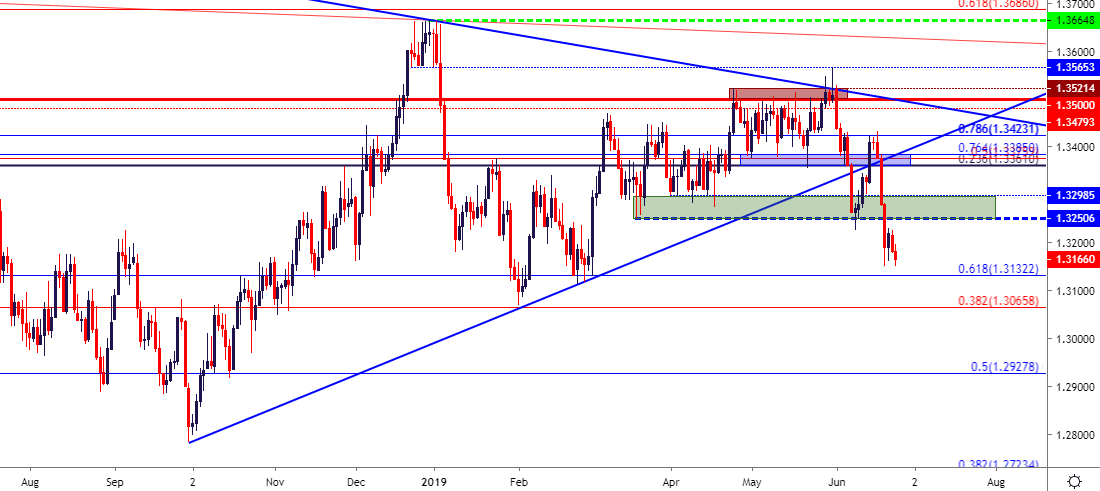
Chart prepared by James Stanley
AUDUSD Pushing Back Towards .7000
It’s been a busy month in the Aussie. The pair found support in May and trended-higher into the opening days of June, even as the RBA cut rates to a record low. The pair eventually found resistance in a zone that runs from .7000-.7019; after which a reversal followed as AUDUSD pushed down to fresh five-month-lows. But, since last week’s emergence of USD-weakness, the pair has clawed-back a large portion of those prior losses and is heading back to that key area of resistance. Can the .7000 area hold another topside advance?
This can keep the pair as attractive for themes of USD-strength for those looking to play a bounce in the US currency.
AUDUSD Four-Hour Price Chart

Chart prepared by James Stanley
To read more:
Are you looking for longer-term analysis on the U.S. Dollar? Our DailyFX Forecasts have a section for each major currency, and we also offer a plethora of resources on Gold or USD-pairs such as EUR/USD, GBP/USD, USD/JPY, AUD/USD. Traders can also stay up with near-term positioning via our IG Client Sentiment Indicator.
Forex Trading Resources
DailyFX offers an abundance of tools, indicators and resources to help traders. For those looking for trading ideas, our IG Client Sentiment shows the positioning of retail traders with actual live trades and positions. Our trading guides bring our DailyFX Quarterly Forecasts and our Top Trading Opportunities; and our real-time news feed has intra-day interactions from the DailyFX team. And if you’re looking for real-time analysis, our DailyFX Webinars offer numerous sessions each week in which you can see how and why we’re looking at what we’re looking at.
If you’re looking for educational information, our New to FX guide is there to help new(er) traders while our Traits of Successful Traders research is built to help sharpen the skill set by focusing on risk and trade management.
--- Written by James Stanley, Strategist for DailyFX.com
Contact and follow James on Twitter: @JStanleyFX


