


Price Action Talking Points:
- Tomorrow’s FOMC rate decision will see considerable focus paid to the banks forward-looking projections.
- With stocks quickly re-ascending back towards prior highs, the big question is whether the Fed will deliver the dovish backdrop that so many market participants have started to look for. Below I look into setups on either side of the scenario.
US Dollar Setting Up for a Drop?
Just last week it looked like a very simple scenario of a strong US Dollar on the back of a less-dovish Fed than what markets had started to look for. And while anticipating a full three rate cuts from the Fed via the dot plot matrix may remain to be a stretch, the strength that’s shown in the currency over the past week has been undeniable. Earlier this morning, USD re-engaged with the prior annual high around the 97.70 level. This is the same level that had previously set resistance in the ascending wedge, which led to topside breakouts in April and May. But, the early-June turn produced a noticeably bearish move that drove all the way until a big area of confluent support could come into play around the 96.47 level.
For tomorrow, the short side appears as attractive. But, with that said, there are a couple of areas that could be more conducive for items of USD-strength, and those are looked at below in pairs such as AUDUSD or USDCAD.
US Dollar Daily Price Chart
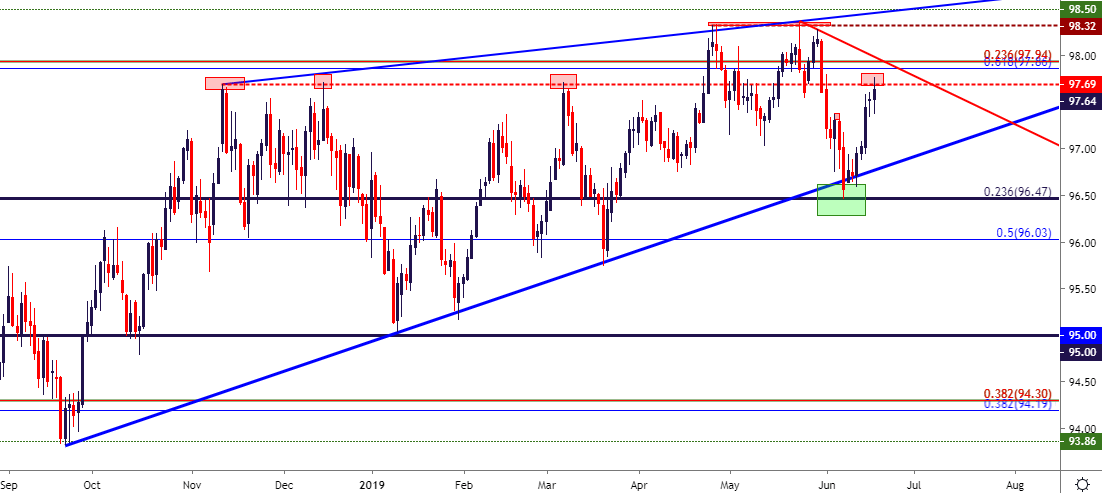
Chart prepared by James Stanley
EURUSD Re-Tests 1.1187 Fibonacci Support
EURUSD has made a fast return to a key support zone. This spans between two Fibonacci levels at 1.1187 and 1.1212; and this zone of support has been in-play for eight months now. This morning brought some dovish comments from ECB President Mario Draghi, and this helped to bring some bearish price action into the Euro. But – that move has thus far been fairly mild as support has simply shown a little lower, and this may speak to the longer-term oversold nature of the pair as the bearish theme has been priced-in for well over a year now. This can keep EURUSD as an attractive venue for themes of USD-weakness.
EURUSD Daily Price Chart
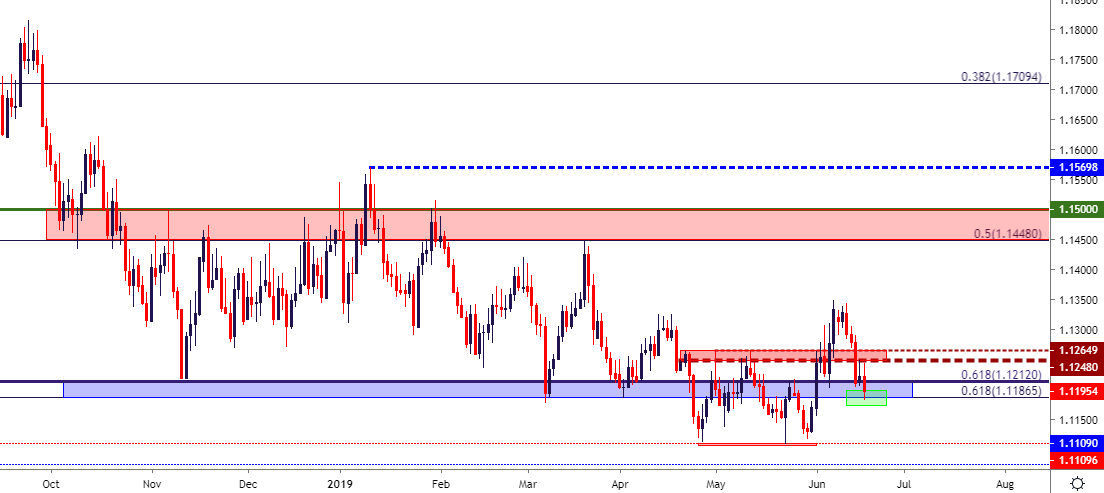
Chart prepared by James Stanley
GBPUSD Bounces From Fibo Support
GBPUSD can be a difficult area tomorrow and the day after FOMC brings a Bank of England rate decision. While neither bank is expected to make a move to rates, a number of issues remains around each. GBPUSD has been in the midst of an aggressive sell-off for over a month now, and a big area of support has just come into play at 1.2523, which is the 14.4% retracement of the ‘Brexit move’ in the pair. This can keep the door open for short-term strength in the pair.
GBPUSD Weekly Price Chart

Chart prepared by James Stanley
USDJPY For Strategies Around USD-Weakness
USDJPY continues to dig-in resistance around the 108.70 level; and this has held even as USD strength came roaring back last week. If we do end up with a legitimate scenario of USD-weakness around tomorrow’s FOMC, this can setup USDJPY for a fairly attractive bearish scenario. Target potential remains around the 107.00 handle.
USDJPY Daily Price Chart
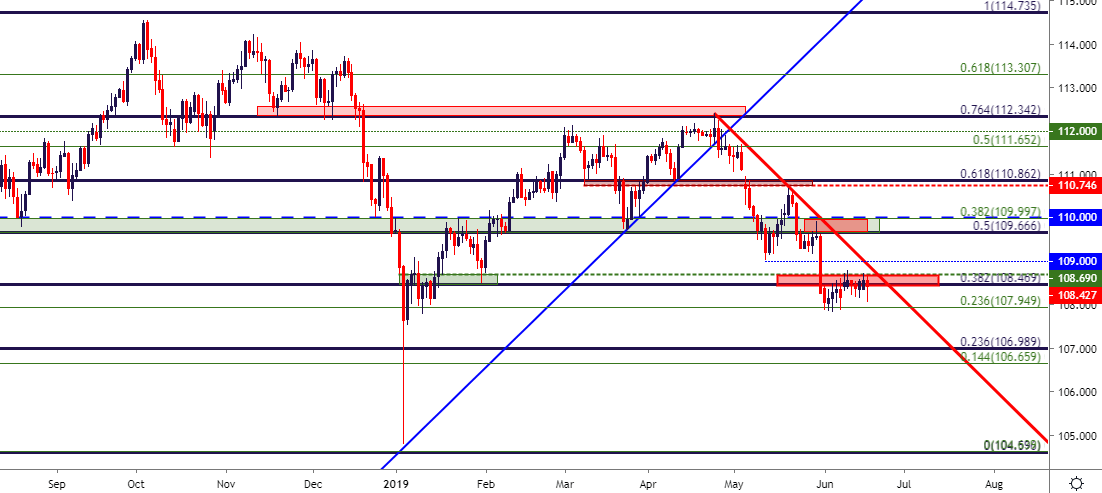
Chart prepared by James Stanley
USDCAD Testing Support in Previously Key Zone
USDCAD remains attractive for bullish-USD scenarios; and similar to the US Dollar’s recent dynamics, it’s Canadian cousin had an intense sell-off to start the month of June. As looked at in last week’s FX Setups, support around the 1.3250, taken from the prior March lows, kept the door open for bullish scenarios in the pair. I had looked at it again coming into this week, and that setup is starting to fill-in with a pullback to support in a previously key zone. This runs from 1.3361-1.3385, and a hold here keeps the door open for target potential at 1.3425, 1.3475 and then the big zone of resistance that rests around the 1.3500 psychological level.
USDCAD Four-Hour Price Chart
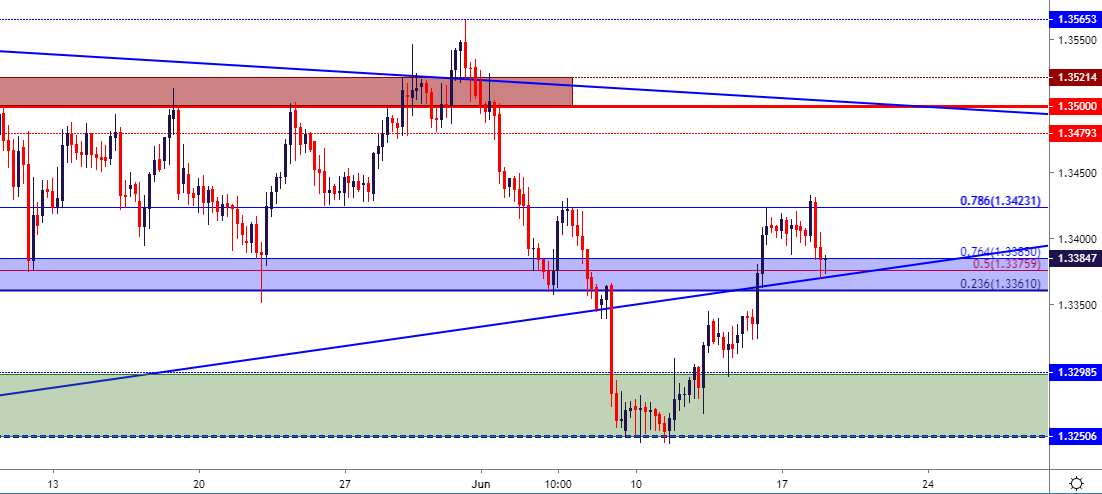
Chart prepared by James Stanley
AUDUSD Bounces From Five-Month Lows, Resistance Potential Nearing
AUDUSD also retains some attractive for long-USD scenarios. The pair broke-down to a fresh six month low after the start of this week’s trade, and prices have started to show a bit of a pullback. This can keep focus on a prior support area, taken from around .6900-.6911 for lower-high resistance potential.
AUDUSD Four-Hour Price Chart
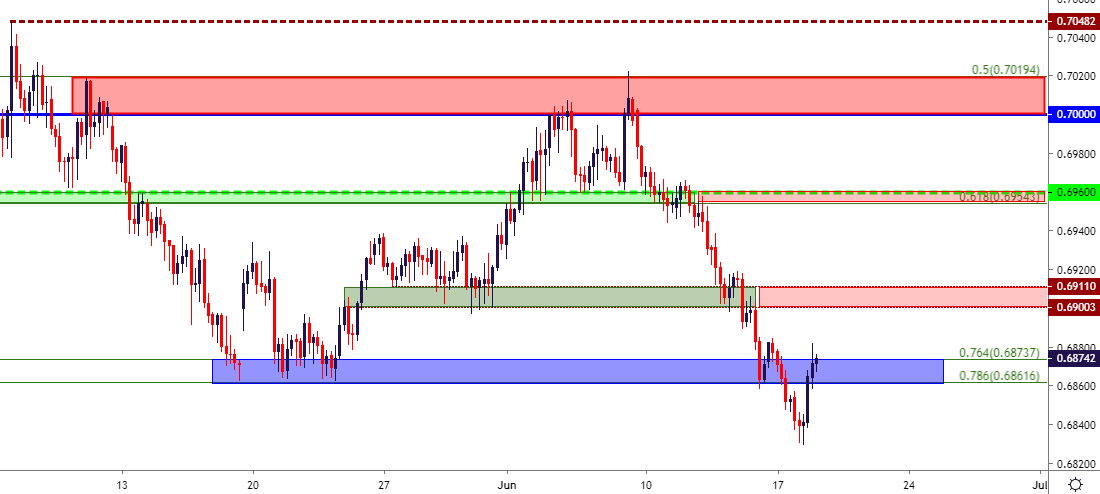
Chart prepared by James Stanley
NZDUSD: Reversal Potential as Pair Pulls Away from Support
Unlike AUDUSD above, NZDUSD has not yet perched down to a fresh low this month. Prices have so far been held above the May lows, taken from a Fibonacci level resting at .6488. This price came back into play yesterday and similarly elicited a bullish response, accented with a slightly higher-low than what printed last month. This, coupled with the slow build of shorter-term higher-highs and higher-lows may soon re-open the door to bullish potential in the pair.
NZDUSD Price Chart
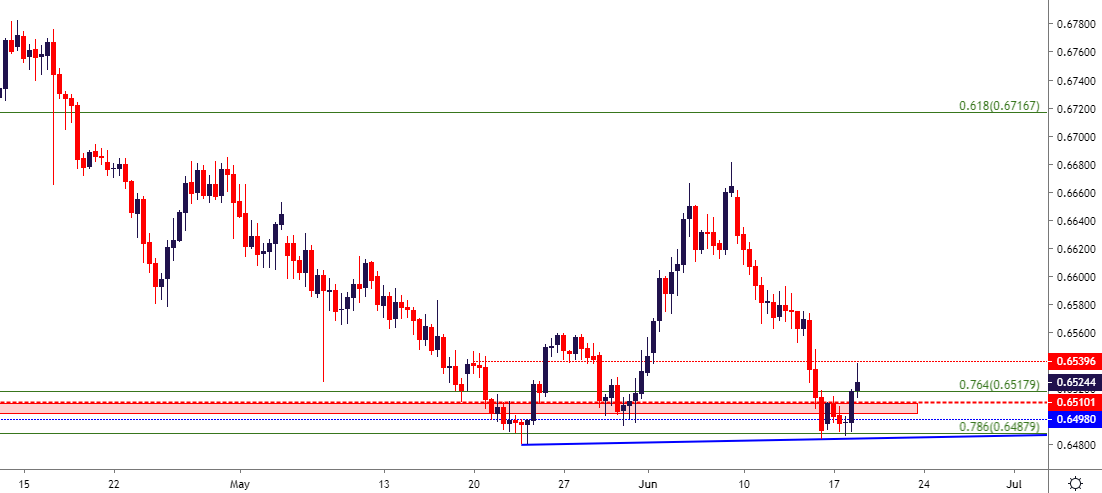
Chart prepared by James Stanley
EURJPY 122.00
I had looked into EURJPY last week, choosing to focus bearish Euro approaches here as opposed to a murky backdrop around EURUSD. EURJPY, since then, has pushed lower each day, and prices have already taken out the first target at 122.00 while making a fast approach towards the second at 120.85. At this point, that prior support target at 122.00 becomes lower-high resistance potential; and for those looking to push a short-Euro stance, this may remain to be more attractive than what’s currently available in EURUSD.
EURJPY Eight-Hour Price Chart
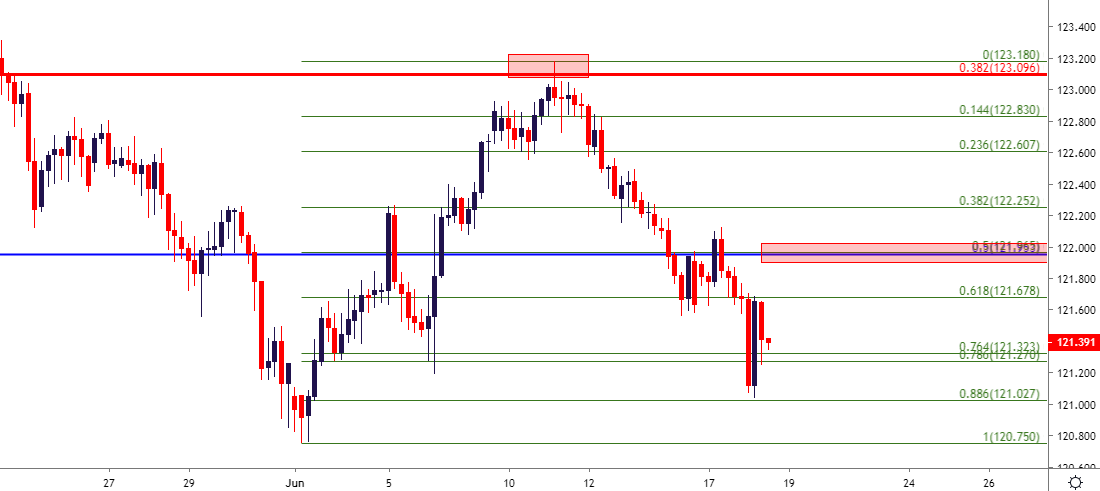
Chart prepared by James Stanley
Gold Ahead of the Fed
Gold prices continue to interact with a big zone of long-term resistance. I discussed that in the piece published earlier today entitled, Gold Price Gears Up for Another Shot at Big Picture Breakout.
Gold Eight-Hour Price Chart
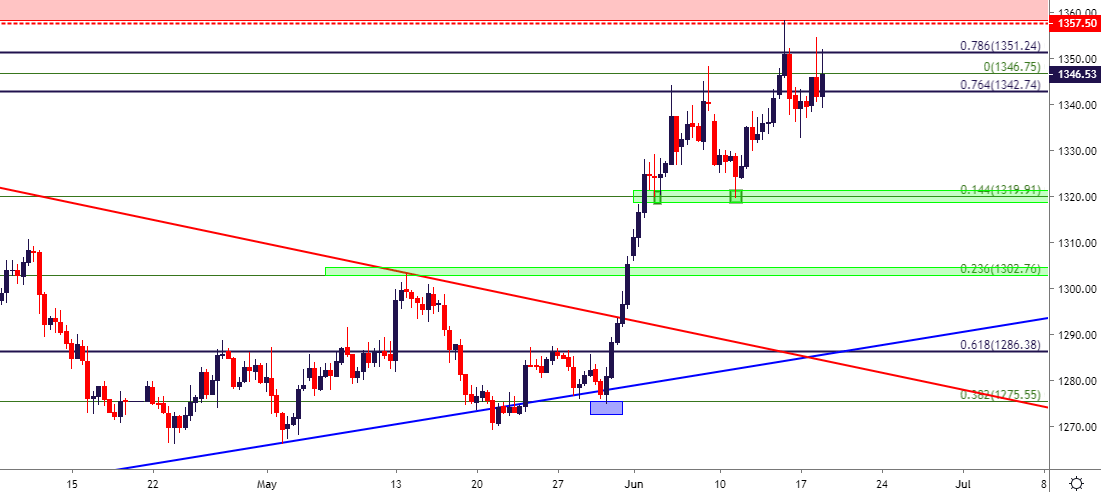
Chart prepared by James Stanley
WTI Crude Oil Carves Out Support in Key Zone
The early-month technical forecast for Crude Oil has continued to play out well. The target contained in that piece around 51.50 has helped to hold the lows for now, and bullish reversal potential remains, with the same levels that in-play as prices work their way back up.
Crude Oil Four-Hour Price Chart
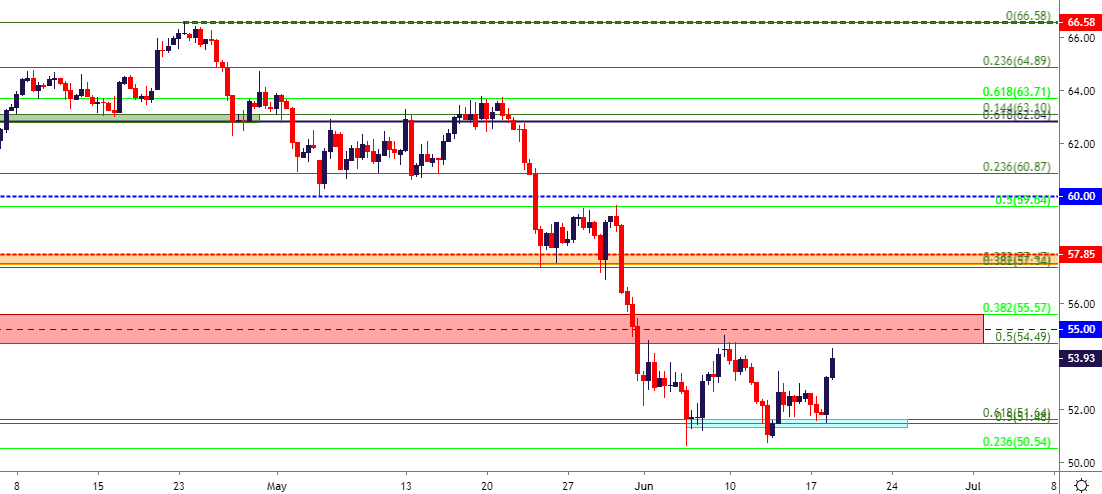
Chart prepared by James Stanley
To read more:
Are you looking for longer-term analysis on the U.S. Dollar? Our DailyFX Forecasts have a section for each major currency, and we also offer a plethora of resources on Oil or USD-pairs such as EUR/USD, GBP/USD, USD/JPY, AUD/USD. Traders can also stay up with near-term positioning via our IG Client Sentiment Indicator.
Forex Trading Resources
DailyFX offers an abundance of tools, indicators and resources to help traders. For those looking for trading ideas, our IG Client Sentiment shows the positioning of retail traders with actual live trades and positions. Our trading guides bring our DailyFX Quarterly Forecasts and our Top Trading Opportunities; and our real-time news feed has intra-day interactions from the DailyFX team. And if you’re looking for real-time analysis, our DailyFX Webinars offer numerous sessions each week in which you can see how and why we’re looking at what we’re looking at.
If you’re looking for educational information, our New to FX guide is there to help new(er) traders while our Traits of Successful Traders research is built to help sharpen the skill set by focusing on risk and trade management.
--- Written by James Stanley, Strategist for DailyFX.com
Contact and follow James on Twitter: @JStanleyFX


