


Though SP 500 has rallied, it has merely reached the underside of a broken trend line. The spike low on USDJPY may initiate a multi-year rally.
The video above is a recording of a US Opening Bell webinar from January 7, 2019. We focused on the Elliott Wave patterns for key markets such as SP 500, NASDAQ, Gold, Silver, USDJPY, NZDUSD, AUDUSD, EURUSD, and DXY.
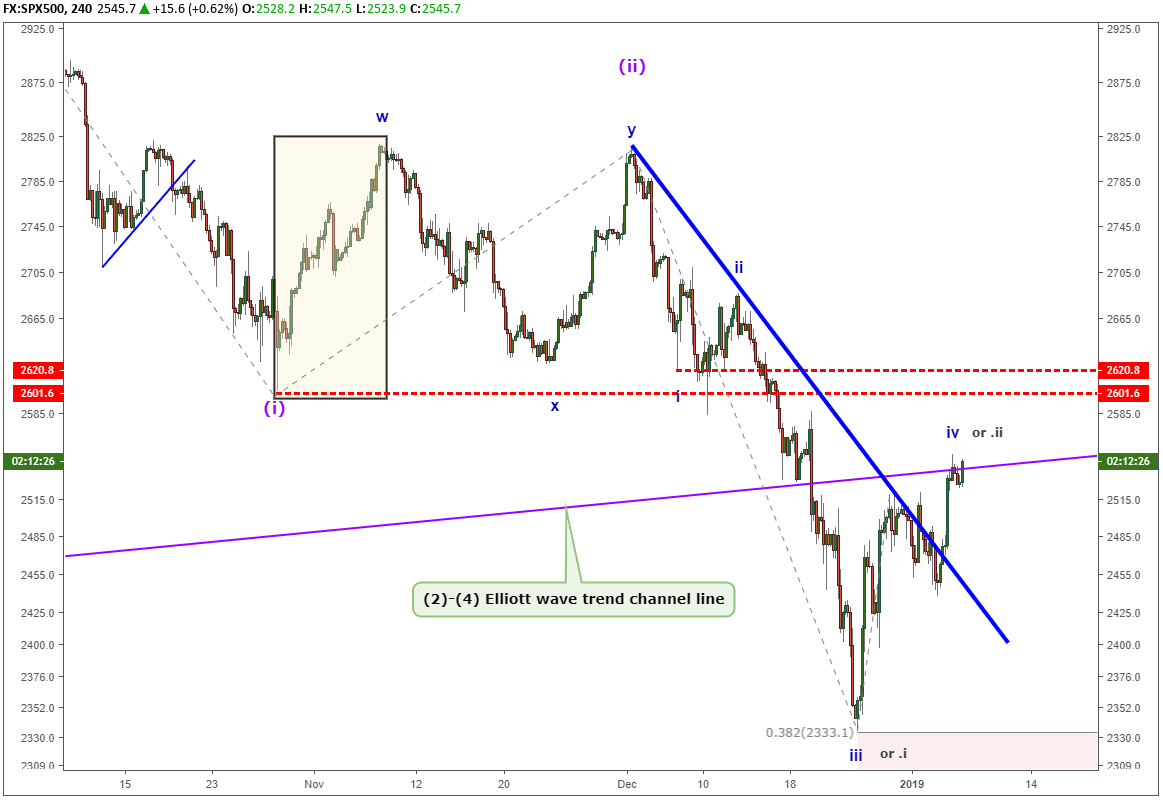
S&P 500 Revisits a Broken Trend Line
We have been highlighting the potential for a stiff fall in S&P 500 since October. When S&P 500 broke below its (2)-(4) trend line, that spelled trouble for the 10-year up trend. As a result, S&P 500 became one our top trade opportunities for 2019.
S&P 500 has rallied for the past week but only to the underside of this Elliott wave trend line. Therefore, S&P 500 is ripe for a continued fall. Some wave relationships show up in 2200, but the potential remains large for a visit to 1800 which represents the previous fourth wave.
Additional reading…
How to Trade S&P 500 Index: Strategies, Tips & Trading Hours
Nasdaq flirts with Elliott Wave Channel and 10-year trend
Nasdaq 100 has yet to break and hold below the (2)-(4) Elliott wave channel from 2009. This channel defines the near-term trend. Any extended wave should only briefly pierce the line. Therefore, a break and hold below the line indicates the trend from 2009 is over. That implies a highly probable visit to the previous fourth wave at the February 2016 low near 3800.
Additional reading…
Top 7 differences between Nasdaq and NYSE

USDJPY May Have begun a multi-year rally in January
After the flash crash occurred last week on the Japanese Yen, levels were breached in USDJPY and EURJPY for us to consider the three year triangle pattern in USDJPY was over and a bull rally may begin.
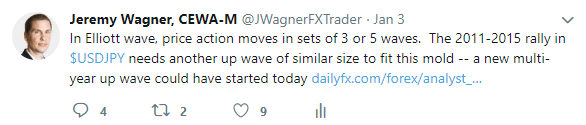
Price action barely held above the March 2018 low. Many times, an Elliott wave triangle ends with a brief breach of the trend line connecting the ends of waves A-C. The price action from last week fit this bill. So, the longer term up trend in USDJPY out to be respected so long as prices remain above 104.70.
Find out what we learned by studying millions of live trades in our Traits of Successful Traders research.
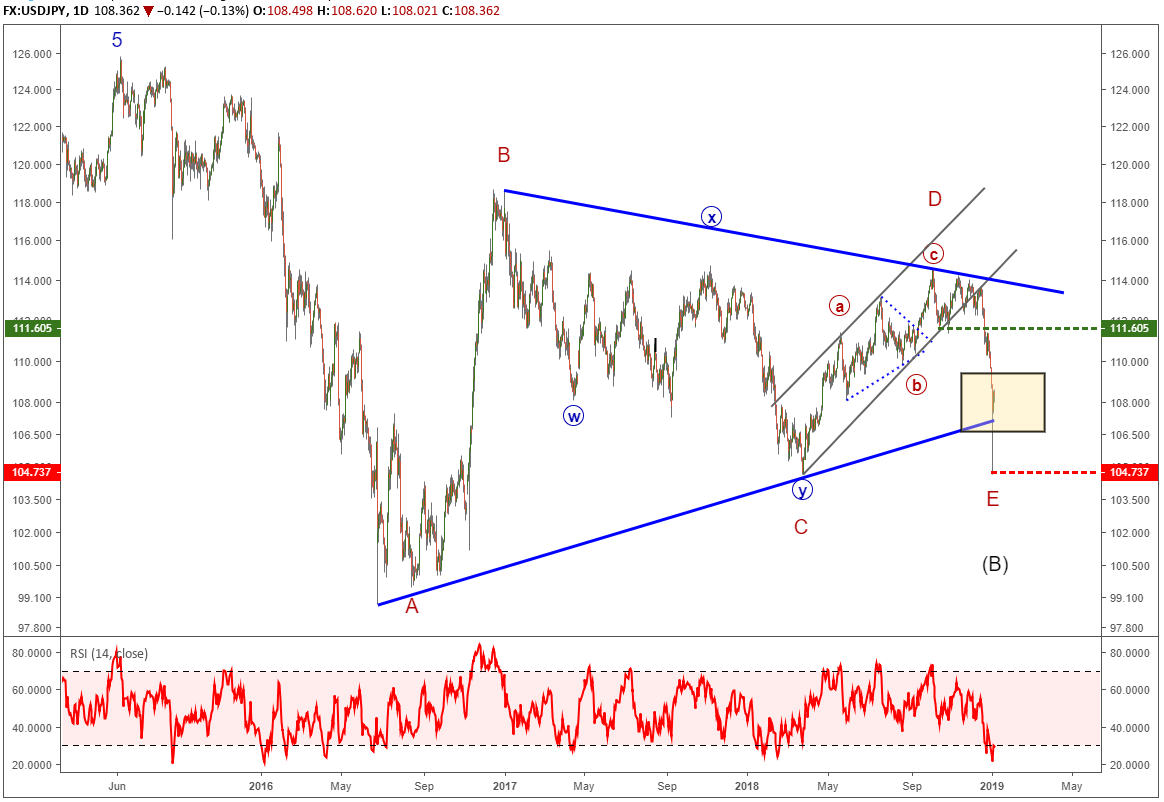
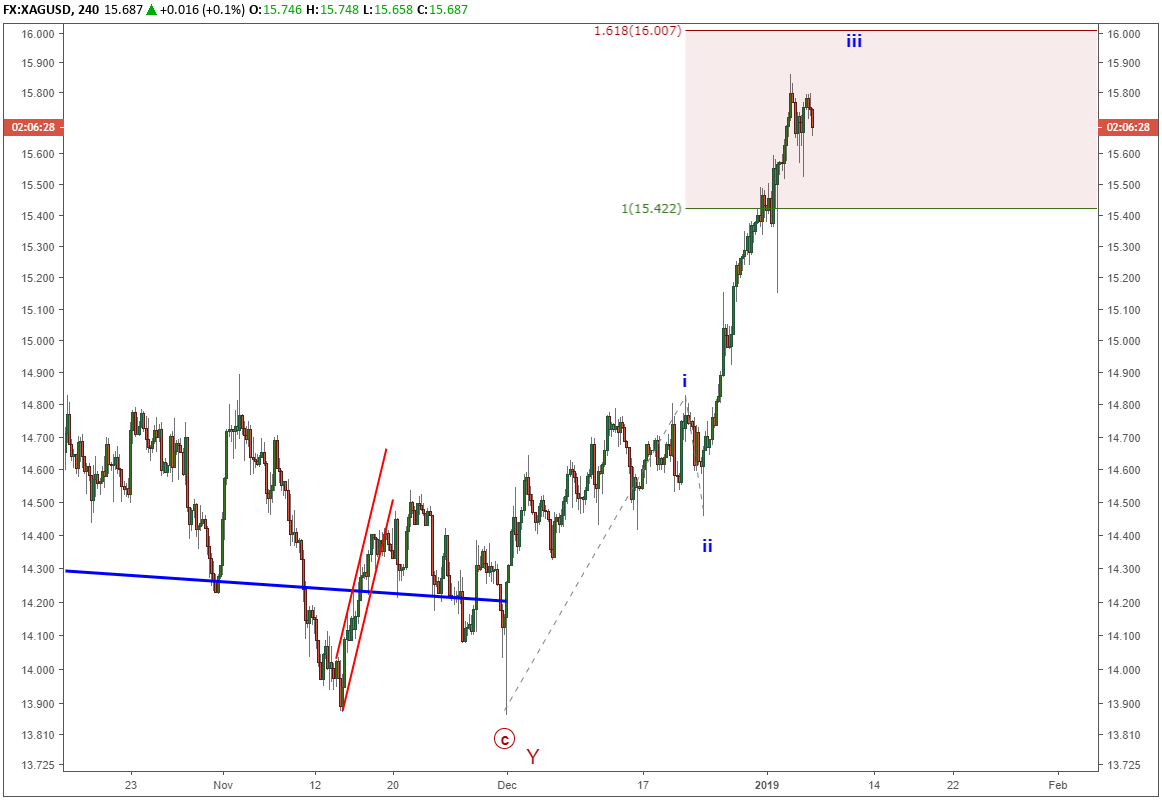
Gold and silver charts show incomplete rallies
Back in late August, we forecasted a gold rally to $1280-$1320. There were two different triangle scenarios we were following, and both of those scenarios pointed towards this price range. Now that the waves have developed and with gold reaching our target levels, the structure of the waves suggest the rally is incomplete. Look for another rally to push higher even if gold prices dip into $1250-$1260.
With the gold to silver ratio still near multi-decade extremes, we feel the potential remains high for silver to outperform gold. Silver’s Elliott wave analysis suggests its rally is incomplete too and a bump to $17 and possibly $19 may be in store.
Additional reading…
Elliott Wave Theory FAQ
How does Elliott Wave theory work?
Elliott Wave theory is a trading study that identifies the highs and lows of price movements on charts via wave patterns. Traders analyze the waves for 5-wave moves and 3-wave corrections to determine where the market is at within the larger pattern. Additionally, the theory maintains three rules and several guidelines on the depth of the waves related to one another. Therefore, it is common to use Fibonacci with Elliott Wave analysis. We cover these topics in our beginners and advanced Elliott Wave trading guides.
After reviewing the guides above, be sure to follow future Elliott Wave articles to see Elliott Wave Theory in action.
---Written by Jeremy Wagner, CEWA-M
Jeremy Wagner is a Certified Elliott Wave Analyst with a Master’s designation. Jeremy provides Elliott Wave analysis on key markets as well as Elliott Wave educational resources. Read more of Jeremy’s Elliott Wave reports via his bio page.
Learn more about how Jeremy got started into Elliott wave from his podcast interview on Trading Global Markets Decoded podcast with Tyler Yell. You can access through:
Stitcher - https://www.stitcher.com/podcast/trading-global-markets-decoded-with-dailyfx/e/57431393
itunes - https://itunes.apple.com/us/podcast/trading-global-markets-decoded/id1440995971
Follow Jeremy on Twitter at @JWagnerFXTrader .
Recent Elliott Wave analysis you might be interested in…
8 scenarios after an Elliott wave impulse pattern completes
Top Trade Idea 2019: S&P 500 Takes a Back Seat with the US Dollar


