


Gold prices reversed higher August 16. The silver price chart shows a similar bottom. The Elliott Wave forecast for gold and silver in the coming months is for higher prices and we are looking for silver to potentially outperform gold for those gains.
Gold and silver chart Elliott Wave analysis talking points:
- Both gold and silver appear to have carved a medium term bottom on August 15-16
- Several Elliott Wave patterns point to 6-10% gains in the coming months
- The gold-silver ratio suggests silver may outperform gold’s rise
Gold’s Elliott Wave chart shows large rally potential
I have been relatively silent on gold’s chart since we called the top back in January and February as the Elliott Wave pattern has a few options at hand. If you recall from our article on January 25 “Gold prices hit 17 month high” (the day of the 2018 high) we forecasted a bearish reversal such that “in the coming months would be a correction down towards $1200.”
A couple weeks later, we published Elliott Wave forecast for Gold and Silver Paint Bullish USD picture. In it, we noted how the “divergence in price behavior [between gold and silver] suggest a bearish reversal may occur near current levels.” Gold price was at $1346 that day and eventually topped out at $1365 prior to a move towards $1160.
Now that the bearish targets are satisfied, we have seen enough evidence that a large rally may mount for the yellow metal.
One of the more obvious patterns we are watching is that of a large triangle. Due to the positioning of the triangle, it is difficult to determine with high degree of confidence if the triangle is longer term bearish or bullish. Both triangles point to gold price gains reaching $1280-$1320.
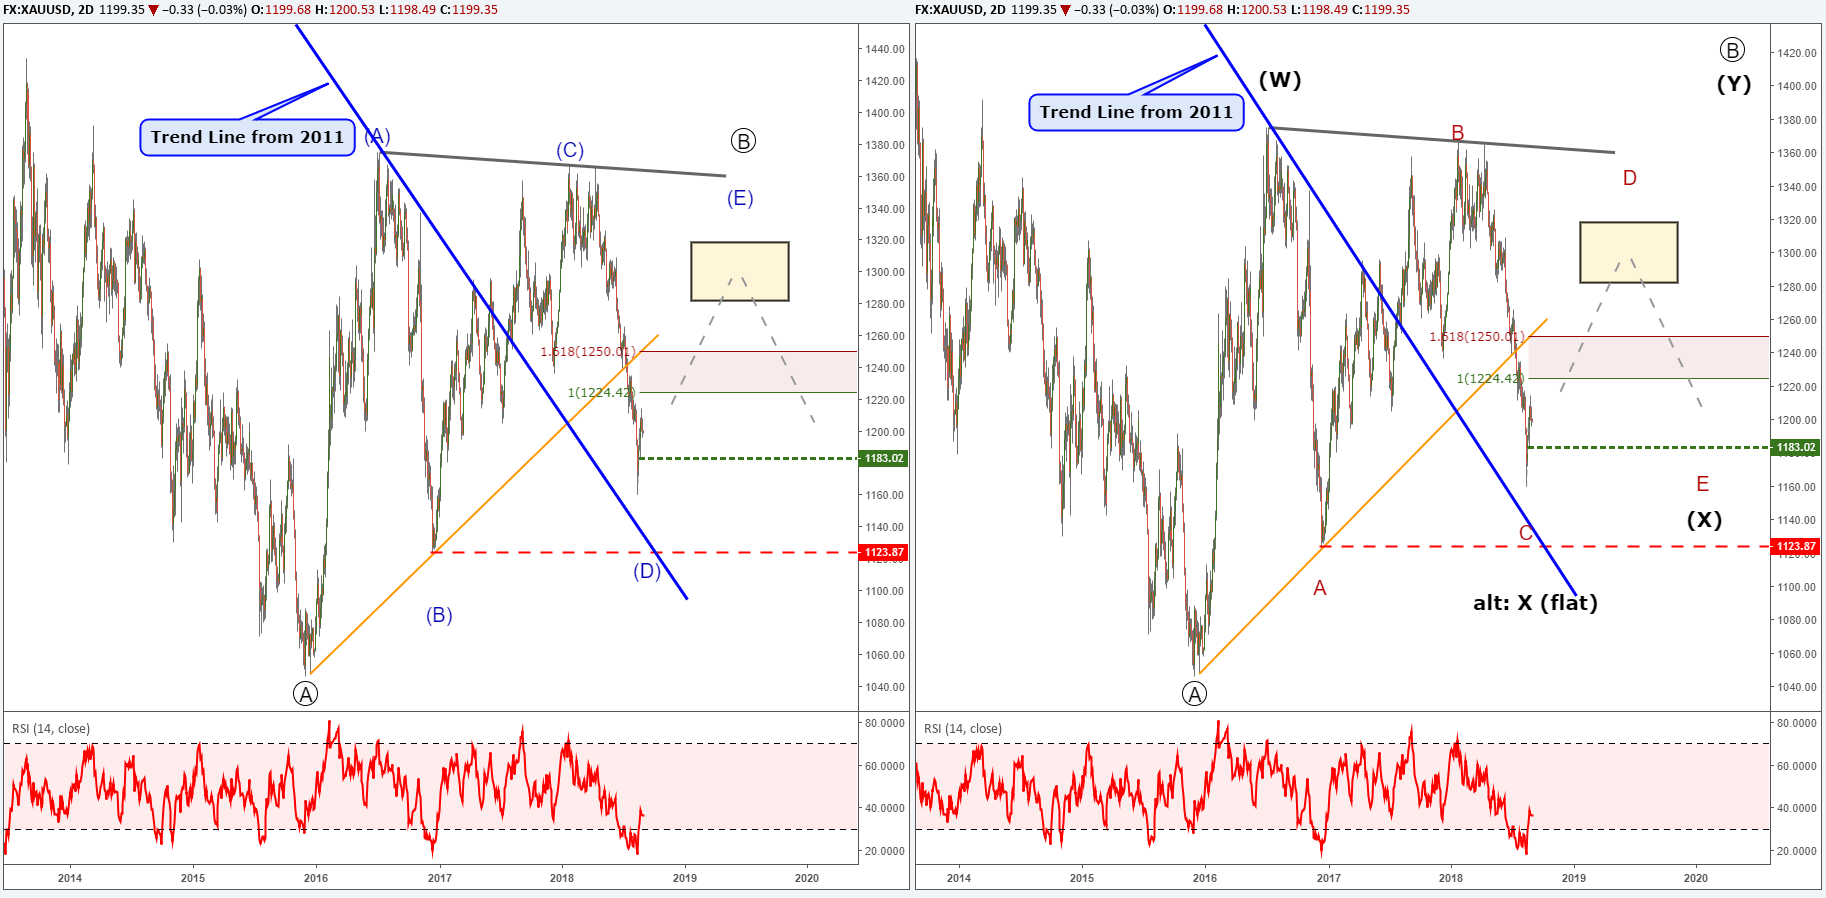
Under both Elliott Wave triangle scenarios, the rise towards $1280 would be temporary. These are not the only possibilities so it is not a guarantee gold prices rise to $1280, but several patterns are pointing to that level.
We are considering an alternate Elliott Wave count in that another secondary low forms in slightly lower levels as an (X) wave flat pattern. From there, gold prices likely rally to above $1380.
Bottom line, several Elliott Wave patterns for gold point towards $1280 and possibly higher. A price move below $1183 allows us to place more weight on the alternate count.
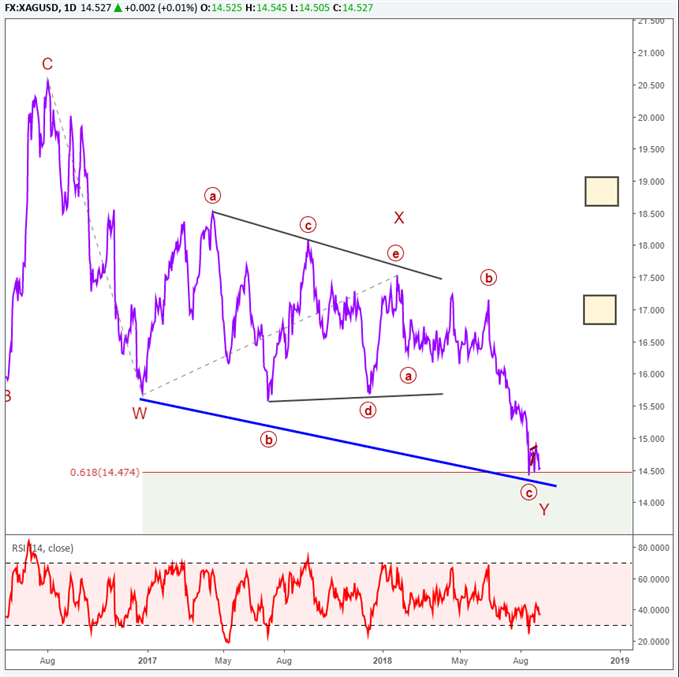
Silver price forecast is for a large rally
Back on February 19, we forecasted a bearish break on silver that would likely “fall to new lows near 14.50”. Silver price chart does show a bottom carved at 14.32 on August 16. Since this low corresponds to the low on gold and the high in US dollar, we feel there is enough evidence to consider the bearish wave from June 2018 to be over and possibly even the wave from the 2016 high. In other words, this could be a BIG low for silver prices. Prices may rally to 17 and possibly 19.
The gold-silver ratio supports outperformance for silver. The ratio is approaching historic extremes and currently sits at 82. The last time it was this high was March 2016 and silver went on to gain approximately 30% to that summer’s high. The time before, the gold to silver ratio moved to 90 during October of 2008 then silver prices went on a massive rally.
I am not suggesting silver will put on another +30% show, but the patterns are forming that elevate the probabilities of strong silver gains on the horizon.
Gold/Silver and Elliott Wave FAQs
How do you trade using the gold-silver ratio?
We discuss two simple trading strategies on using the ratio. One is using the ratio to determine the stronger trend to trade between gold and silver. The second strategy is trading the metals at historic ratio levels. I encourage you to visit trading the gold-silver ratio strategies and tips.
Regardless of how you trade, make sure to incorporate our Traits of Successful traders research. In it, we unpack the habits we discovered of successful traders.
What is Elliott Wave Theory?
Elliott Wave Theory is a forex trading study that identifies the highs and lows of price movements on charts via wave patterns. Traders often analyze the 5-wave impulse sequence and 3-wave corrective sequence to help them trade strategically. We cover these wave sequences in our beginners and advanced Elliott Wave trading guides.
---Written by Jeremy Wagner, CEWA-M
Jeremy is a Certified Elliott Wave Analyst with a Master’s designation. These articles are designed to illustrate Elliott Wave applied to the current market environment. View Jeremy’s bio page for other recent Elliott Wave analysis.
Communicate with Jeremy and have your shout below by posting in the comments area. Feel free to include your Elliott Wave count as well.
Follow on twitter @JWagnerFXTrader .


