


Gold prices recently hit their highest level in 17 months. According to the Elliott Wave principle, this recent break above $1357 indicates we are in a big ‘B’ wave with a gold price forecast of a bearish reversal occurring soon.
Gold Chart Elliott Wave Analysis Talking Points:
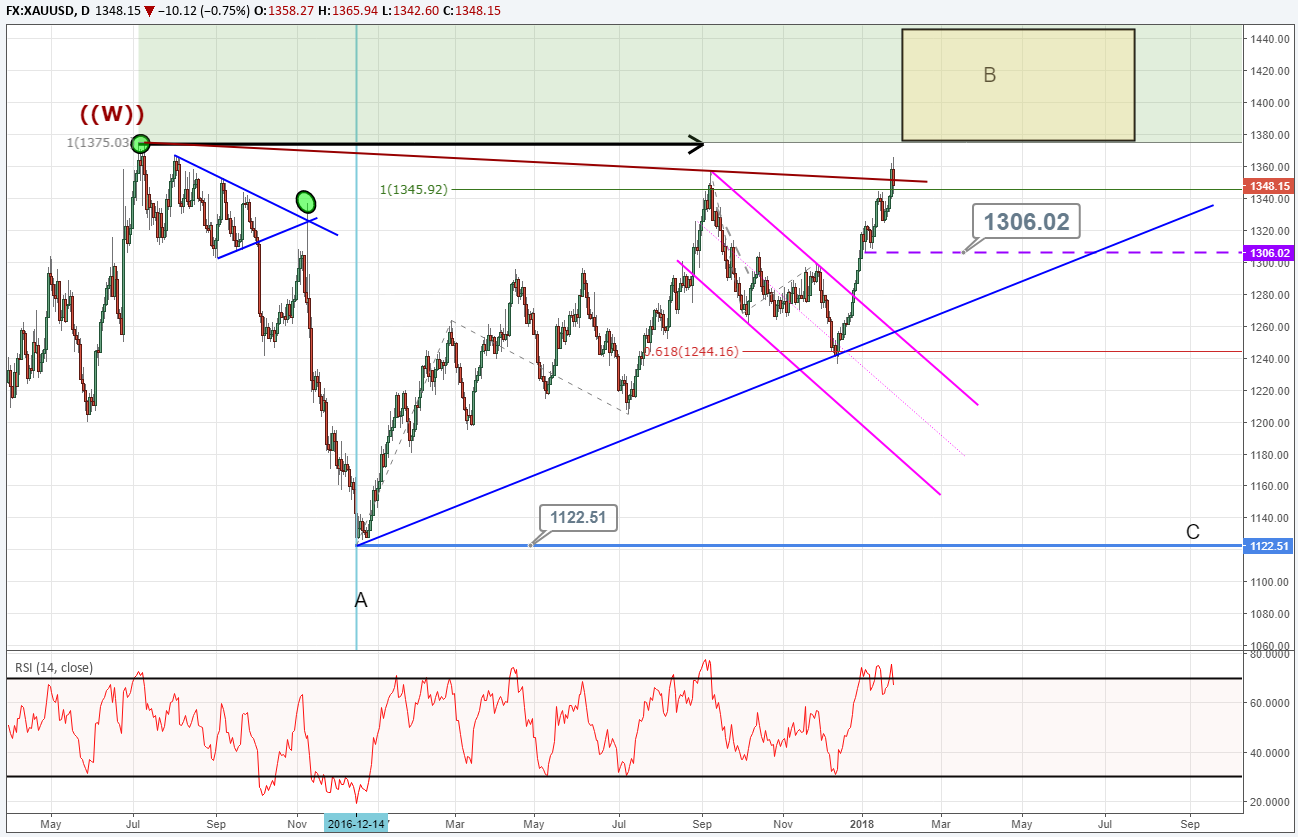
- The gold price break above $1357 elevates the possibility the December 2016 trend to now is a large ‘B’ wave
- An eventual ‘C’ wave lower may carry back towards $1200
- A break below $1306 would increase the probability wave ‘B’ is finished and wave ‘C’ has begun
The gold price trends have been sloppy since December 2016. That sloppy behavior is evidence of a three-wave move, a correction. Therefore, the current increase in gold prices may not last long.
The break above $1357 eliminates the near term triangle possibility and indicates the rise since December 2016 is a large ‘B’ wave. ‘B’ waves tend to be sucker waves that are sloppy and overlapping and the trend for the past year fits that description. The Elliott Wave analysis calls for gold prices to remain below $1465.
Bearish Reversal Towards $1200
In the Elliott Wave sequence, once the ‘B’ wave terminates, we can anticipate a large portion of the December 2016 up trend to be retraced. Therefore, the gold price forecast in the coming months would be for a correction down towards $1200. The structure of the sell off would provide us clues as to the depth it may carry. For now, we will locate a generalized target near $1200.
Gold Prices Below $1306 Suggests a Top is in Place
Our gold price forecast is for a bearish reversal to occur between now and $1465. Though that is a large region, we can use simple technical analysis to help us enter into the bearish reversal.
For example, a break below $1306 would begin to carve a lower low in gold prices. A successful move below $1306 will allow us to analyze the charts for a bearish 5-3 wave sequence. The bearish 5-3 wave pattern would allow us to use the swing high as a risk level.
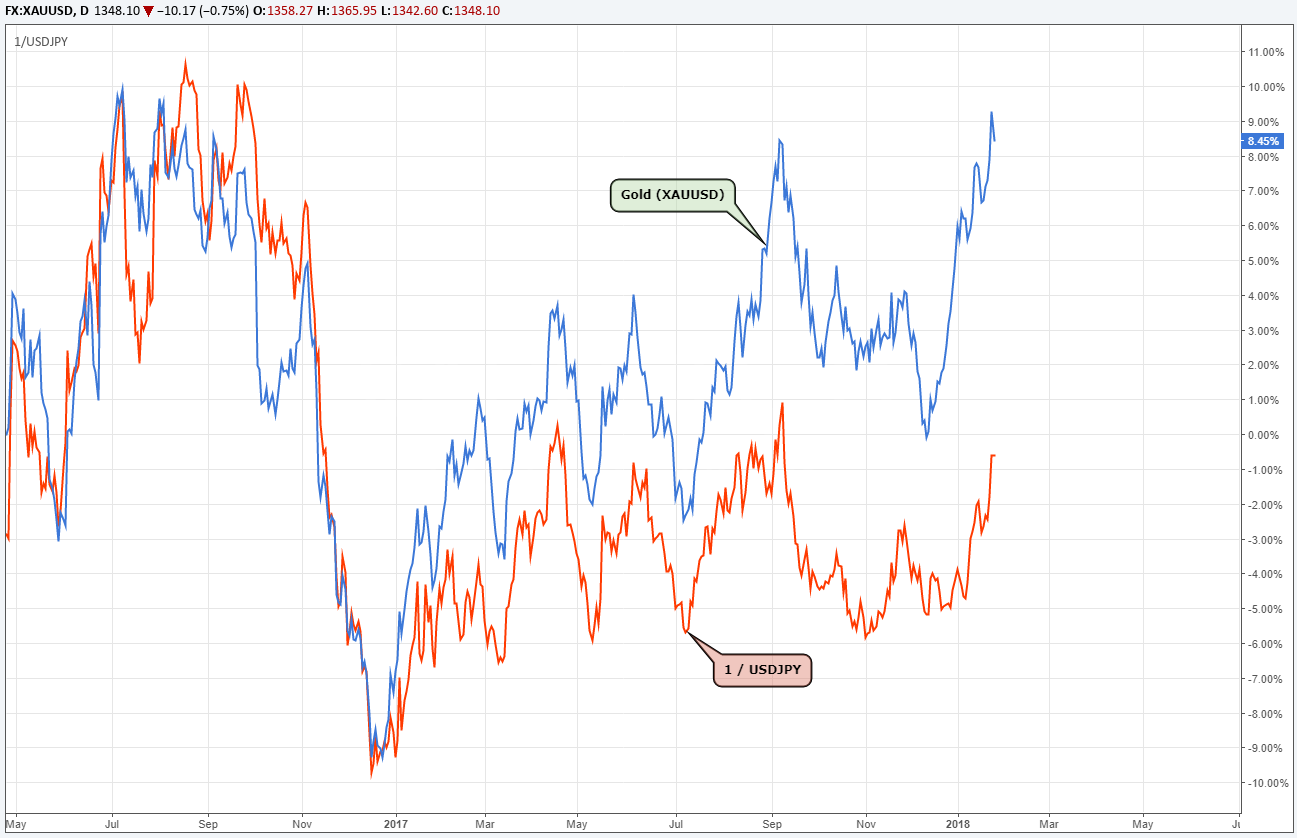
One other factor I will keep an eye on is the USD/JPY exchange rate. Gold and USDJPY have been moving inversely to one another until lately. It comes as no surprise that my Elliott Wave analysis for USDJPY has that pair in a complex ‘B’ wave too. On the chart below, I plotted Gold against the inverse of USDJPY and they have been tracking each other closely.
Notice below how gold prices have pushed to new recent highs while the red line struggles to break the September 2017 high. If we begin to see the red line break support (USDJPY reverse to the upside and break resistance levels), then that may be an early warning signal of a looming gold price correction.
Elliott Wave and Gold FAQs
What is Elliott Wave Theory?
Elliott Wave Theory is a forex trading study that identifies the highs and lows of price movements on charts via wave patterns. Traders often analyze the 5-wave impulse sequence and 3-wave corrective sequence to help them trade strategically. We cover these wave sequences in our beginners and advanced Elliott Wave trading guides.
Why wait for $1306 before entering short? Wouldn’t you miss the reversal?
Trading is more than entry and exit signals. Account management is as important relative to anything else in your trading. Therefore, as a trader, I am seeking out strategic places on the chart to where I can identify the trend, risk level, and target level that is consistent with the habits of successful traders. Though we are not calling the exact top and reversal point, we are identifying those strategic areas where we have a higher probability to extract a large portion of the trend.
---Written by Jeremy Wagner, CEWA-M
Jeremy is a Certified Elliott Wave Analyst with a Master’s designation. These articles are designed to illustrate Elliott Wave applied to the current market environment.
Communicate with Jeremy and have your shout below by posting in the comments area. Feel free to include your Elliott Wave count as well.
Gold was one of the key markets discussed in a special year webinar “What 2 Watch 4 in 2018”. Register to view.
Follow on twitter @JWagnerFXTrader .
Join Jeremy’s distribution list.


