


FX Price Action Setups in EUR/USD, USD/CNH, USD/CAD and NZD/USD
It’s been a busy week already and tomorrow brings an extra quotient of risk as US markets will be closed for an official day of mourning for former US President, George H.W. Bush. This means that the Jerome Powell semi-annual Humphrey Hawkins testimony that was set to begin on Wednesday has been postponed to a yet-to-be-named date; and the next major USD item on the calendar is Friday’s release of Non-Farm Payrolls data from the month of November.
The equity ramp that showed at the beginning of this week has now been completely faded-out, and prices in the Dow are dipping into territory that had come into play on the heels of Chair Powell’s speech last week. The US Dollar, meanwhile, has put in a bifurcated day of price action as weakness leading into this morning down to a key Fibonacci level has brought buyers back to the bid, and prices are now jumping towards an area of unfilled gap on the chart that runs up to around 97.19. In this webinar, I looked at price action setups around the US Dollar, focusing on major currency pairs in the effort of devising strategy.
Forex Talking Points:
- If you’re looking to improve your trading approach, our Traits of Successful Traders research could help. This is based on research derived from actual results from real traders, and this is available to any trader completely free-of-charge.
- If you’re looking for a primer on the FX market, we can help. To get a ground-up explanation behind the Forex market, please click here to access our New to FX Trading Guide.
If you’d like to sign up for our webinars, we host an event on Tuesday and Thursday, each of which can be accessed from the below links:
Tuesday: Tuesday, 1PM ET
Thursday: Thursday 1PM ET
US Dollar Bounces From Fibonacci Support
The US Dollar gapped-down to start this week’s trade and bears remained fairly-active on the open, continuing to push-lower without allowing that gap to fill-in. This led to a test of the bullish trend-line that’s been at work for the past couple of months yesterday morning, and that bounce also failed to fill-in the gap that remains from 94.04-94.19. Weakness continued to push into this morning, after which the 96.47 Fibonacci support level came back into play.
US Dollar Hourly Price Chart
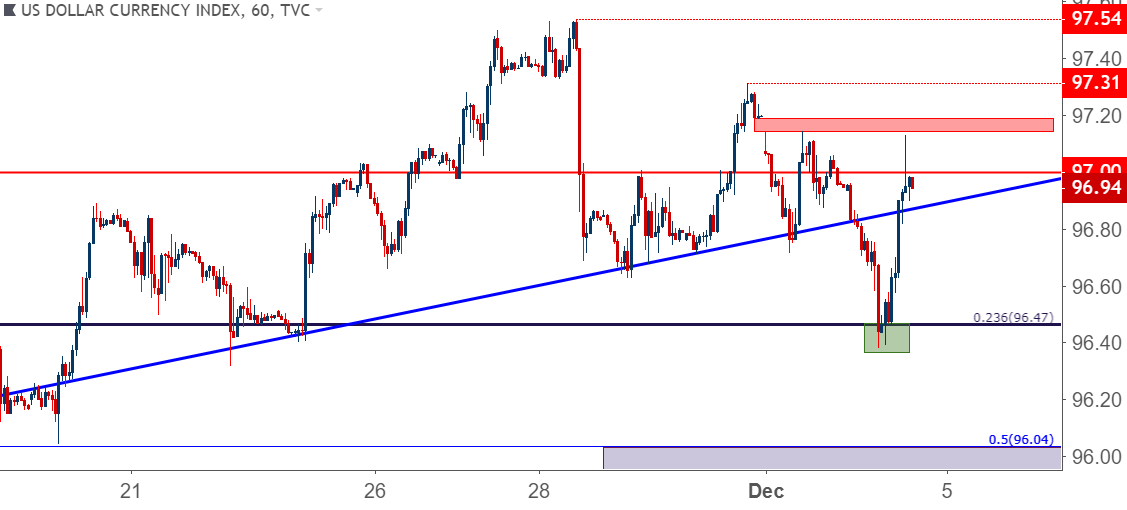
Chart prepared by James Stanley
After a few hours of struggle, bulls were able to re-grab control to propel prices back to the 97.00 area. Unfilled gap remains, and the key here is monitoring how deeply bulls can drive. If the swing-high from last week is taken-out at 97.31, the scope for further upside is there, and the door could soon re-open to topside strategies in the US Dollar. If, on the other hand, that gap fills and then sellers hold resistance below this prior swing, the door remains open for short-side strategies, and that could be attractive in venues such as NZD/USD and USD/CNH.
US Dollar Four-Hour Price Chart
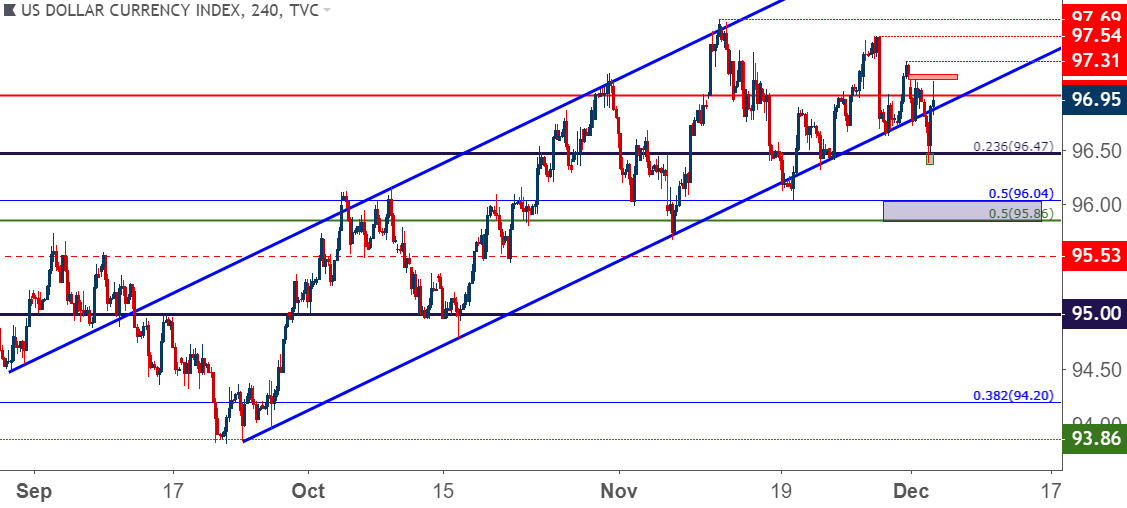
Chart prepared by James Stanley
EUR/USD Streak of Higher-Lows Nears Trend-Line Resistance
From a number of vantage points, the past month has been relatively quiet in EUR/USD, as the pair has continued to build into a symmetrical wedge pattern.
EUR/USD Four-Hour Price Chart

Chart prepared by James Stanley
On a shorter-term basis, the big question is whether bulls can continue to push after bringing-in a series of higher-lows over the past few weeks. Sellers remain active, as shown from last week’s resistance hold at 1.1400. But this week, prices were able to edge above that level, even if by a little bit, and this shows a potential shift in the balance-of-power in the pair, with sellers getting a bit more shy while bulls grow more anticipatory as indicated by higher-low support.
In the webinar, I discuss how to move forward with a formation such as the symmetrical wedge as shown below. Wait for the break to get a directional bias, and then look for a pullback to open the door for exposure potential on continuation strategies.
EUR/USD Two-Hour Price Chart
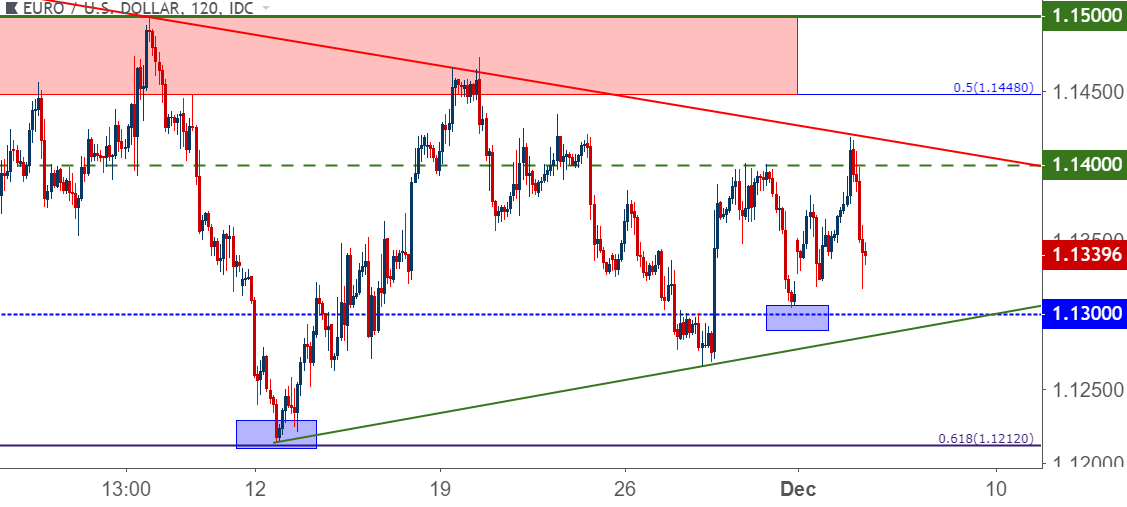
Chart prepared by James Stanley
GBP/USD: Cable Flickers to Fresh Low as Brexit Continues in a Messy Manner
Next week brings the Parliament vote for Theresa May’s Brexit plan, and matters never really looked all that positive there. A blow may have been dealt before the vote ever takes place, and this showed up earlier today when UK Parliament found the government in contempt. So, the vote next week isn’t looking so positive.
As discussed by our own Martin Essex, this opens a series of options, including the potential for a new Prime Minister, which may turn out to be Pound-positive.
Nonetheless, the pair remains in a dangerous spot, as prices quickly set a fresh yearly low before pulling-back above the Fibonacci level that helped to set that support. This can be a difficult move to plot for continuation as prices still remain rather far away from nearby resistance swings.
GBP/USD Four-Hour Price Chart

Chart prepared by James Stanley
USD/CHF Builds Higher Lows with Parity Holding Resistance
I discussed this last week, but the prior theme of USD/CHF weakness doesn’t look as attractive after the support test at .9902 two weeks ago. Bullish breaks above parity could soon re-open the door for topside strategies.
USD/CHF Four-Hour Price Chart
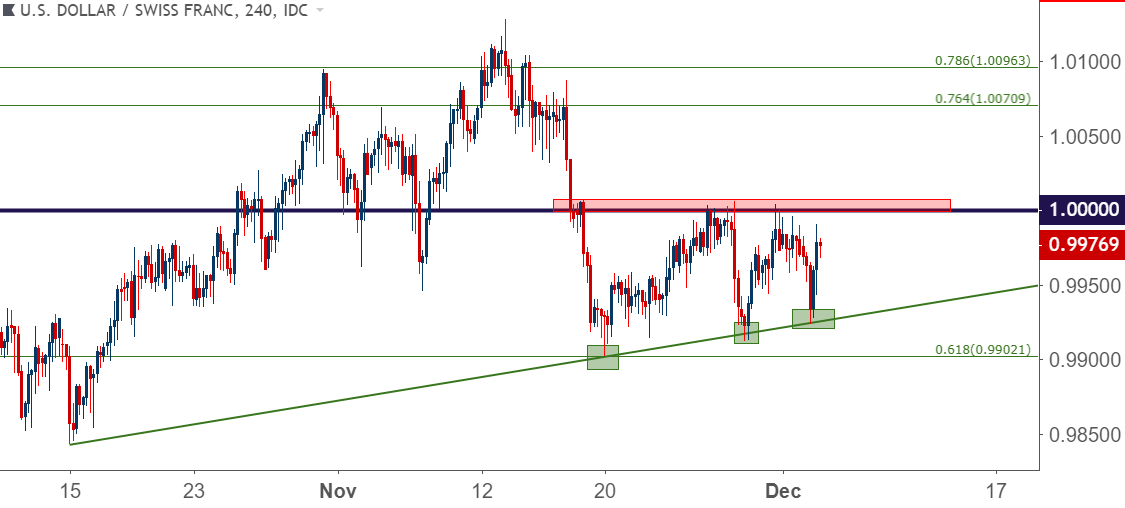
Chart prepared by James Stanley
USD/CNH to Two Month Lows as Yuan Reversal Gains Speed
I had looked at this one a month ago, essentially trying to catch a top as USD/CNH neared a key resistance level at 6.9875. It took a few weeks for the setup to show much attraction, but to open this week Yuan-strength has been back in the cards and this has helped to bring both targets into play. The bigger and more important question at this point: Is there more room to run on the downside?
USD/CNH was in a concerted up-trend from April into October, and if this theme does hold there may be more room to run.
USD/CNH Daily Price Chart
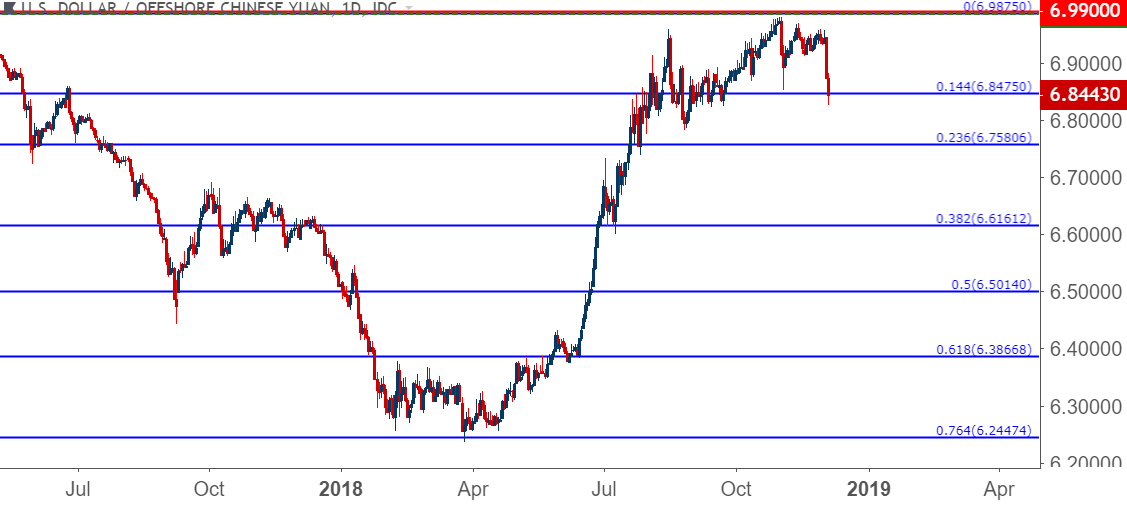
Chart prepared by James Stanley
USD/CAD Finds Resistance at Prior Support
USD/CAD was in a strong and consistent up-trend leading into this week. The pair gapped-lower to go along with that move in DXY, and prices peeled below the bullish trend-line that’s been in place since the start of Q4. At this point, the zone that I had used for prior support is now helping to show short-term resistance, and this lines up with the under-side of that bullish trend-line. Similar to USD/CHF above, there may be a flip scenario taking place here, although it’s still in the very early stage. The remaining unfilled gap up to last week’s close around 1.3300 would likely need to be filled before short-side setups can become attractive.
USD/CAD Four-Hour Price Chart
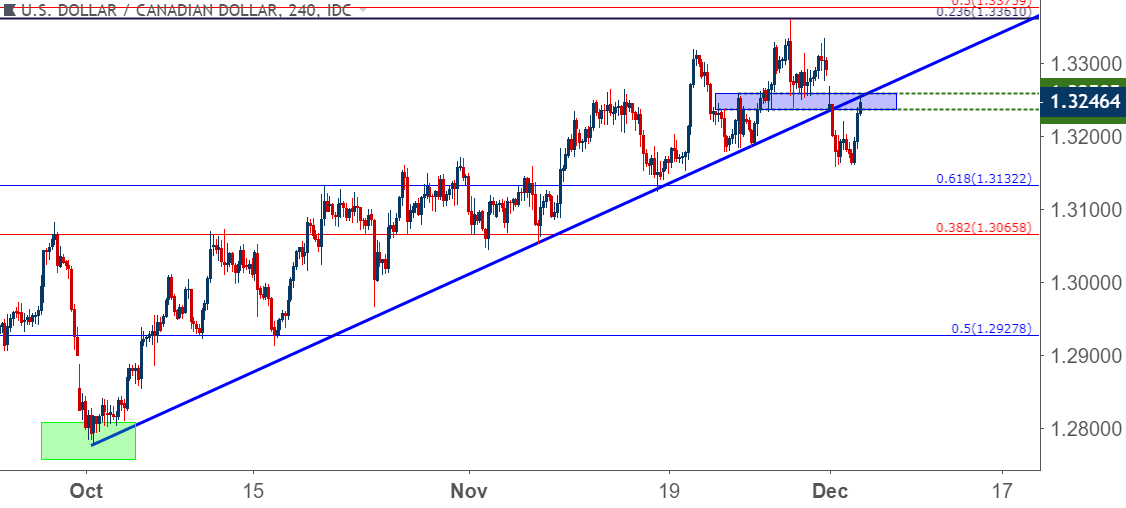
Chart prepared by James Stanley
NZD/USD Pulls Back from Fresh Five-Month Highs
It’s been a positive Q4 for the Kiwi since a difficult first nine months of the year. The month of October saw a build of support even as the US Dollar was jumping up to fresh yearly highs, and as soon as November opened along with some USD-weakness, NZD/USD was set to fly-higher on the chart. That theme of strength has largely remained since, with a couple of resistance inflections helping to show key areas on the chart. One of those areas that had held the highs on two separate occasions last week remains as support potential, and this runs from around .6870-.6877. In the webinar, I discussed a few options for working with that setup.
NZD/USD Four-Hour Price Chart
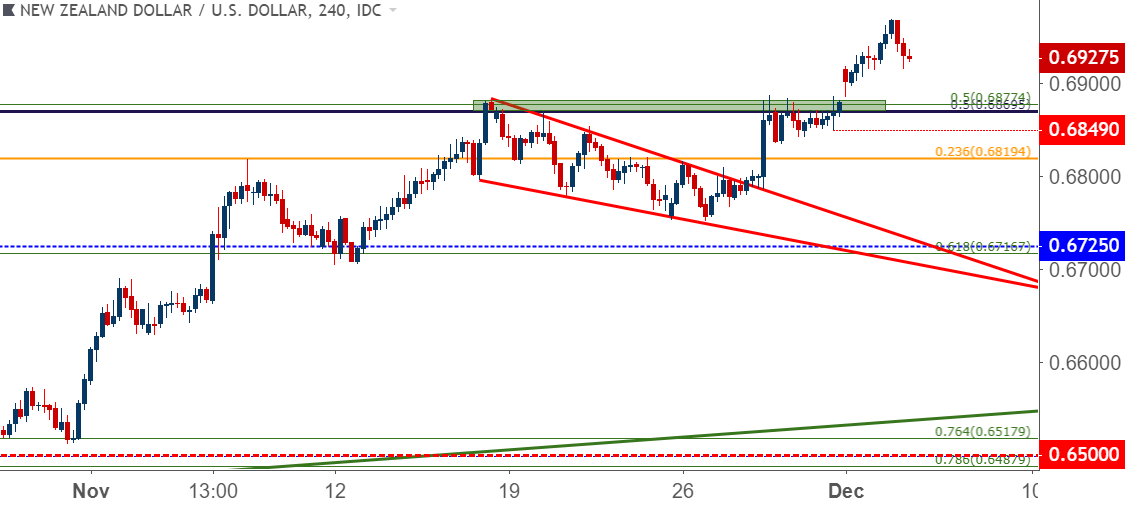
Chart prepared by James Stanley
To read more:
Are you looking for longer-term analysis on the U.S. Dollar? Our DailyFX Forecasts for Q4 have a section for each major currency, and we also offer a plethora of resources on USD-pairs such as EUR/USD, GBP/USD, USD/JPY, AUD/USD. Traders can also stay up with near-term positioning via our IG Client Sentiment Indicator.
Forex Trading Resources
DailyFX offers an abundance of tools, indicators and resources to help traders. For those looking for trading ideas, our IG Client Sentiment shows the positioning of retail traders with actual live trades and positions. Our trading guides bring our DailyFX Quarterly Forecasts and our Top Trading Opportunities; and our real-time news feed has intra-day interactions from the DailyFX team. And if you’re looking for real-time analysis, our DailyFX Webinars offer numerous sessions each week in which you can see how and why we’re looking at what we’re looking at.
If you’re looking for educational information, our New to FX guide is there to help new(er) traders while our Traits of Successful Traders research is built to help sharpen the skill set by focusing on risk and trade management.
--- Written by James Stanley, Strategist for DailyFX.com
Contact and follow James on Twitter: @JStanleyFX


