


EUR/USD, US Dollar Talking Points:
- The US Dollar has broken-below the bullish trend-line that’s been at work for the past two months, and a bit of support has shown up around the familiar Fibonacci level of 96.47. This is the 23.6% retracement of the 2011-2017 major move in the US Dollar and had last come into play two weeks ago. This has helped EUR/USD to push above the 1.1400 level after failing there last week, and this extends a pattern of higher-highs and lows in the pair.
- Tomorrow is a market holiday as US markets are closed for an official day of mourning to mark the passing of former US President, George H.W. Bush. The Jerome Powell semi-annual Humphrey Hawkins testimony has been cancelled, and this comes after his comments last week provided a strong boost to the risk trade.
- DailyFX Forecasts on a variety of currencies such as the US Dollar or the Euro are available from the DailyFX Trading Guides page. If you’re looking to improve your trading approach, check out Traits of Successful Traders. And if you’re looking for an introductory primer to the Forex market, check out our New to FX Guide.
Do you want to see how retail traders are currently trading the US Dollar? Check out our IG Client Sentiment Indicator.
US Dollar Pulls Back, US Markets Closed Tomorrow, Powell Testimony Postponed
This week’s economic calendar may have caught a bit of relief after Jerome Powell’s semi-annual Humphrey Hawkins testimony was postponed. Tomorrow, US markets will be closed for an official day of mourning for former US President, George H.W. Bush; and with D.C. out of the office, Chair Powell’s speech has postponed to a yet-to-be-named date. This comes at a key time as Chair Powell’s comments last week provided a quick and strong boost to equity prices.
Last week saw a shift in the language of the Fed Chair, and this helped to provide a sense of support to equities after what had become a troubling prior seven weeks of price action. US stocks turned in early-October after Chair Powell opined that the Fed was ‘a long way’ from the neutral rate, which is the theoretical interest rate at the bank in which policy is neither stimulative nor restrictive. Those comments in early-October were heavily inferred to mean that the Fed had plans for even more interest rate hikes in 2019, and in short order the bullish breakouts that drove equity prices higher throughout Q3 were taking a bearish turn.
But in Mr. Powell’s comments last week, his language around the bank’s proximity to the neutral rate was a bit less threatening, as he opined that the FOMC was ‘just under’ this rate. That helped equity prices to fly-higher, and that strength extended into the end of the week, and into the G20 meeting in Argentina.
Dow Jones Four-Hour Price Chart
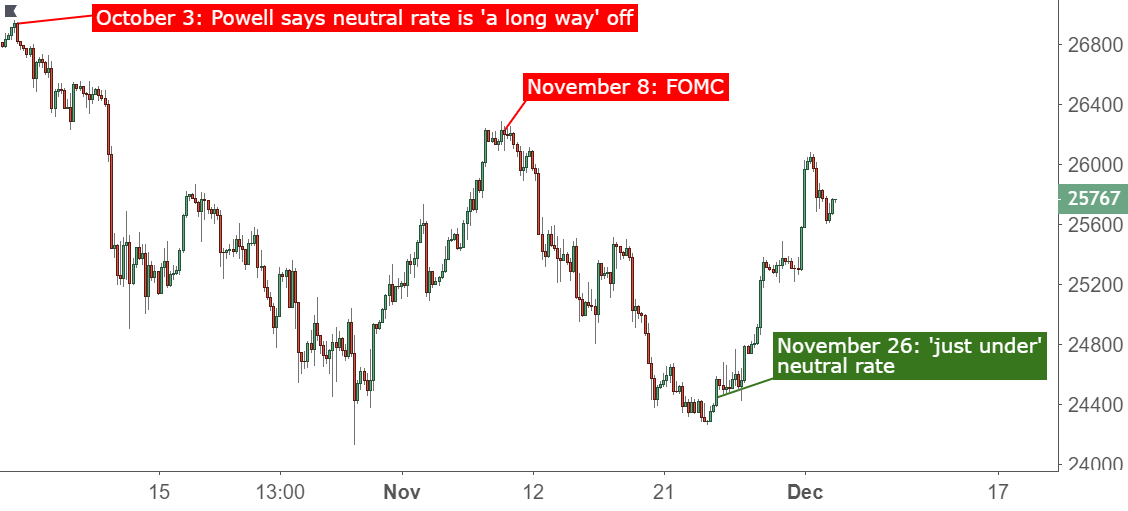
Over the weekend, another bullish drive availed itself around the China-US trade war. This was covered by our own Justin McQueen yesterday in his article entitled, S&P 500 and Dow Jones Outlook: US-China Trade War Truce Sparks Rally.
That led to a quick gap-higher as futures opened for trade on Sunday, and prices pushed above the 26k level temporarily ahead of the US open. When US equity markets did open for the day, that pullback extended; but thus far buyers have held-up prices above the key area on the chart around 25,500. On the hourly chart below, a series of lower-lows and lower highs remains in short-term price action. The key for the next couple of days would be to see support set-in so that higher-highs and higher-lows begin to show again; and that could open the door to bullish continuation strategies.
Dow Jones Four-Hour Price Chart
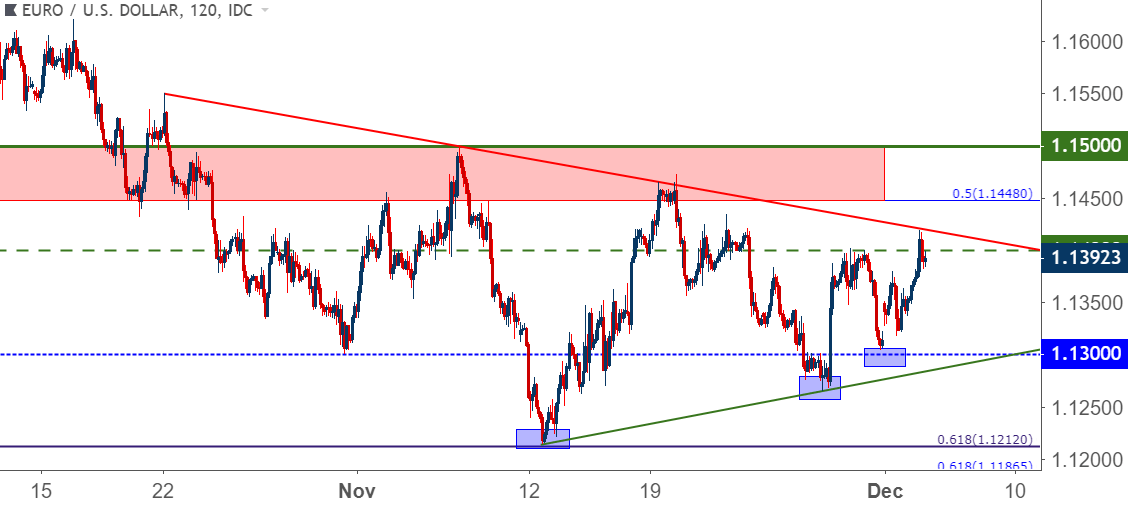
EUR/USD Climbs Above 1.1400 as the US Dollar Takes a Bearish Turn
In yesterday’s article, I looked at the higher-lows that have built in EUR/USD over the past few weeks, and this was extended into December after buyers showed support right around the low of the weekend gap in yesterday’s session. That’s led into a fresh weekly high as bulls have pushed above the same 1.1400 level that they shied away from last Thursday; and prices are now nearing a bearish trend-line that can be found by connecting the October 22nd swing-high to the November high, the projection of which helped to hold resistance later in the month.
EUR/USD Two-Hour Price Chart: Higher-Highs Approaching Trend-Line Resistance
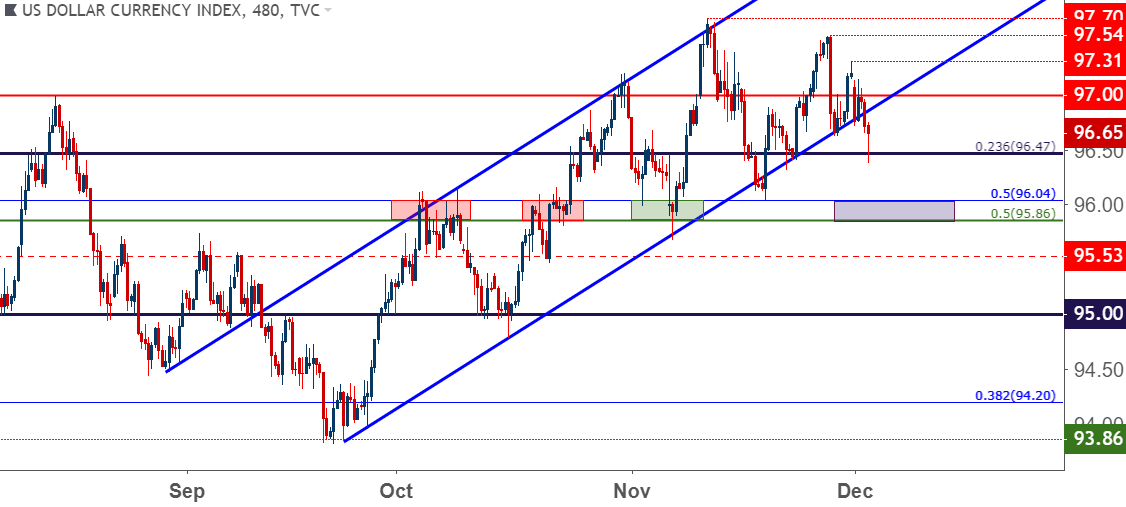
US Dollar Bounces From Fibonacci Support
The US Dollar is testing below the bullish trend-line again as the lower-highs looked at yesterday have extended into fresh lower-lows. The US Dollar is working on fresh weekly lows after sellers pushed prices down to the 96.47 Fibonacci level, making a concerted to drive prices below a trend-line that’s been in-play for the past two months.
US Dollar Hourly Price Chart
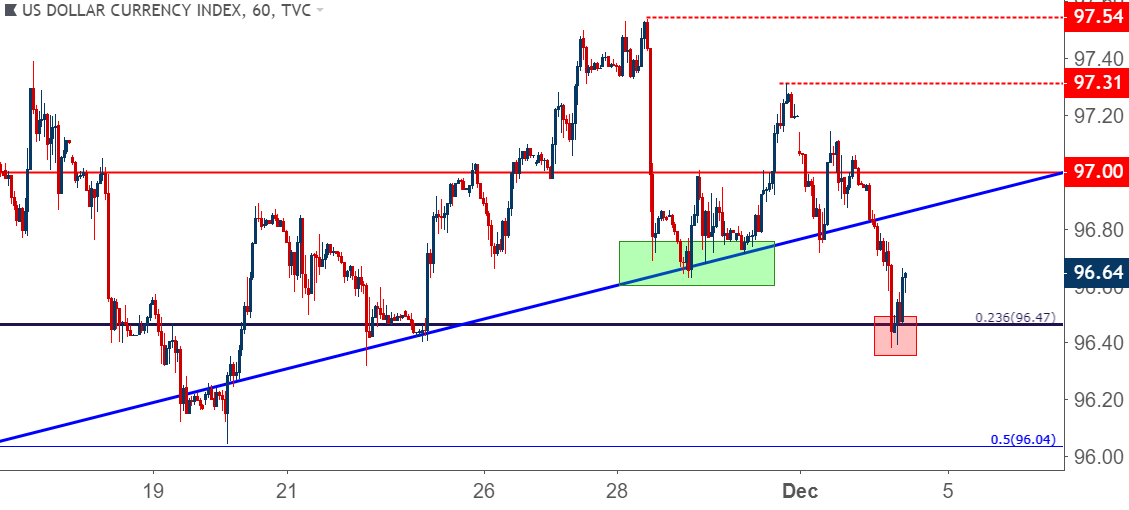
The next major area of support interest on the pair is the zone that helped to arrest the lows three weeks ago, and this runs around the 96.04 level which is the 50% marker of the 2017-2018 down-trend in the currency. A bit deeper, around 95.86 is another level of interest, as this is the 50% mid-point of the 2001-2008 major move in DXY. This zone came in to help set resistance on two separate occasions in October before buyers were finally able to push through, and once that happened the same price zone helped to set support in early-November.
US Dollar Eight-Hour Price Chart
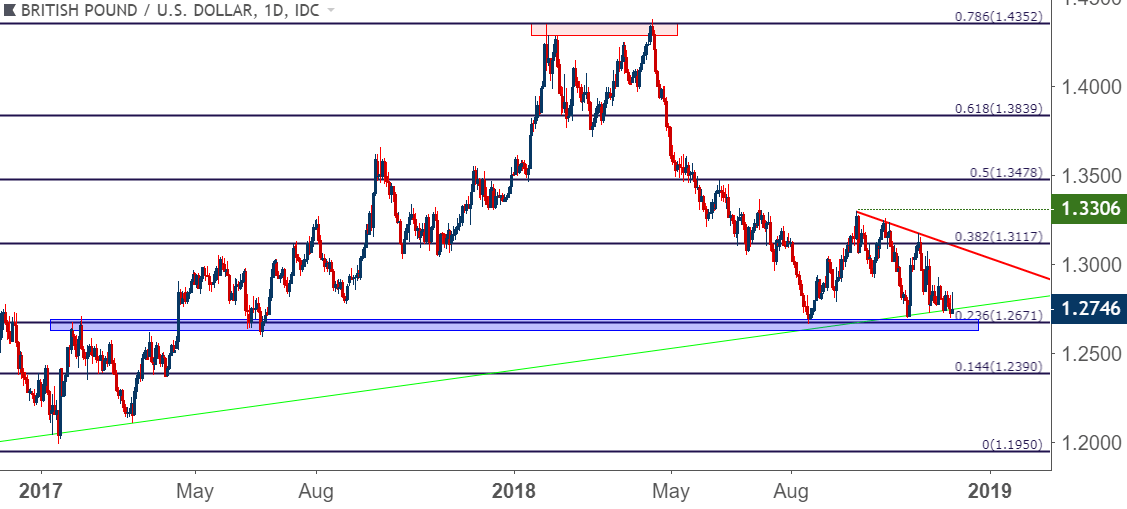
GBP/USD Rallies After the EU Dangles ‘Remain-Route Carrot’ in Front of the UK
This was discussed at length earlier this morning by my colleague, Nick Cawley, in his article entitled Brexit News: Sterling (GBP) Soars After EU Dangles Brexit Carrot.
This led to a quick move of strength in GBP/USD after sellers shied away from the three-month low around yesterday’s open. This extends a rather difficult period for the currency, as GBP/USD has been working with back-and-forth price action for the better part of the past three months. The support side of that churn has a number of key levels sitting underneath and bears at this point appear uninterested in testing below.
But the challenge remains: Will GBP/USD be able to elicit fresh sellers upon breaks of this support? And if so, for how long might that move extend? This makes for a rather complicated backdrop, as there is little optimism currently showing around the matter, yet sellers haven’t been able to make much ground below 1.2700 so far this year. As Martin Essex discussed, the upcoming House of Commons vote appears unlikely to pass, and that failure could bring on four different scenarios, none of which appear to be very positive for the Pound.
GBP/USD Daily Price Chart
NZD/USD Pulls Back From Fresh Five-Month Highs
On the side of USD-weakness, I’ve been following NZD/USD since October as the pair had started to build in a base of support even when the US Dollar was trending up to fresh yearly highs. As phases of USD-weakness have started to price-in from those early November highs, prices in NZD/USD have jumped above a number of resistance levels, making a fast approach towards the .7000 big figure.
At this point, a prior area of resistance offers higher-low support potential, and this takes place around a confluent area on the chart with two different Fibonacci levels in close proximity. The price of .6877 is the 50% marker of the 2015-2017 major move, and the level of .6871 is the 50% marker of the 2009-2011 move. This zone helped to hold the highs on two separate occasions last month; and price action this week gapped above this level, leaving a bit of unfilled gap on the chart. This becomes an area of interest for higher-low support for bullish continuation strategies in NZD/USD.
NZD/USD Four-Hour Price Chart
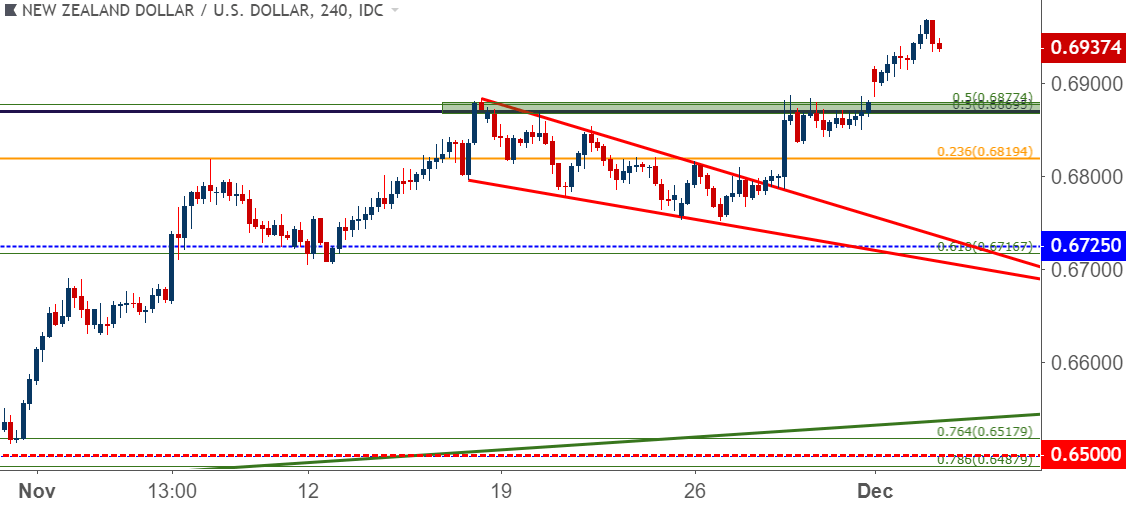
Chart prepared by James Stanley
To read more:
Are you looking for longer-term analysis on the U.S. Dollar? Our DailyFX Forecasts for Q4 have a section for each major currency, and we also offer a plethora of resources on USD-pairs such as EUR/USD, GBP/USD, USD/JPY, AUD/USD. Traders can also stay up with near-term positioning via our IG Client Sentiment Indicator.
Forex Trading Resources
DailyFX offers a plethora of tools, indicators and resources to help traders. For those looking for trading ideas, our IG Client Sentiment shows the positioning of retail traders with actual live trades and positions. Our trading guides bring our DailyFX Quarterly Forecasts and our Top Trading Opportunities; and our real-time news feed has intra-day interactions from the DailyFX team. And if you’re looking for real-time analysis, our DailyFX Webinars offer numerous sessions each week in which you can see how and why we’re looking at what we’re looking at.
If you’re looking for educational information, our New to FX guide is there to help new(er) traders while our Traits of Successful Traders research is built to help sharpen the skill set by focusing on risk and trade management.
--- Written by James Stanley, Strategist for DailyFX.com
Contact and follow James on Twitter: @JStanleyFX


