


SPY S&P 500 ETF, Bed Bath & Beyond, Fed, USDJPY and GBPCAD Talking Points
- The Fed announced plans to start reducing its monthly purchases, also referred to as a taper, as the post-pandemic recovery unfolds and inflation pressures prove unrelenting
- Despite raising boundaries around previously indefinite support, the Dollar wouldn’t find traction and risk benchmarks like the S&P 500 managed to charge higher
- The Fed’s shift will exact influence for months ahead, but immediate volatility is more the outlet of Thursday’s BOE rate decision or Friday’s NFPs

Risk Appetite Unrelenting in Its Drift, Speculative Appetite Continues to Chase
There was a lot of fundamental headwind this past session, but that hasn’t done anything to cap the speculative charge. Despite the Federal Reserve’s announcement that it was officially throttling back on its open-ended stimulus program Wednesday at its official FOMC update, the major US indices managed to squeeze out fresh record highs across the board. The S&P 500’s 0.6 percent advance wasn’t particularly aggressive, but it was an impressive extension that kept spot prices moving well ahead of the 20-day moving average – a medium-term trend measure. Notably, the Nasdaq 100 and Dow Jones Industrial Average would also register records of their own, but it was the broad Russell 2000’s return to record highs that really stood out. Is an outlook of tighter monetary policy simply not a concern or are speculators getting their shots in now before for the inevitable but slow steer away from excess? I believe the latter scenario is more likely.
Chart of SPY S&P 500 ETF with 20-Day SMA, Volume and 20-Day Disparity (Daily)
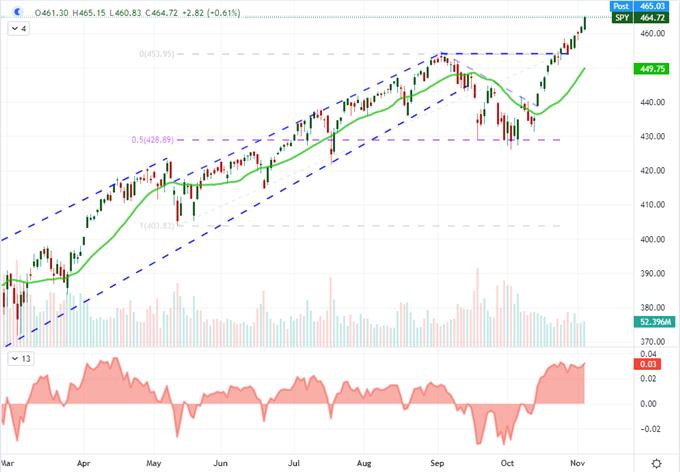
Chart Created on Tradingview Platform
In evaluating the markets more ignoble appetite for volatility, there are a few measures of note that I tend to monitor. The appetite for tech shares relative to the broader US equity market is a higher touch point. More generally, US stocks relative to their global counterpart is one of the more persistent measures over the past decade. Far more aggressive is a recent return in the appetite for heavily shorted stocks. Bypassing the evangelism of SPACs and the ‘disruption’ appeal of expected unicorns, a lurid charge behind thinner stocks with a heavy short position relative to the total public float is far pronounced a charge for short-term speculative appetite. On Tuesday, the Avis charge was a top headline in this category while a more than 50 percent gap higher on the open for Bed Bath & Beyond Wednesday morning shows the market is still hunting with opportunism in mind.
Chart of Bed Bath & Beyond with 20-Day SMA, Daily Gaps and 20-day Disparity (Daily)
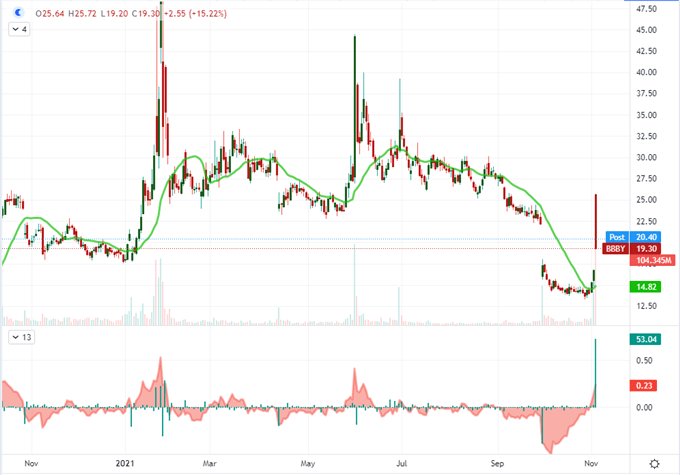
Chart Created on Tradingview Platform
Wait…Did the Fed Actually Taper?
If we were to take our news from price action alone, it would seem like the Federal Reserve monetary policy decision that crossed the wires this past session were a non-event. Of course, the actual outcome brought a remarkable shift in the undercurrent of global policy. The central bank kept its benchmark rate unchanged as widely expected, but it would also announce the taper of its hearty $120 billion-per-month stimulus program…again, as expected. The group will reduce its monthly purchases by $15 billion per month and theoretically sets out an end to the post-pandemic QE drive around June of next year. That is a meaningful shift, but it was also fully expected. Given that there are months of central bank infusions ahead, there is a strong motivation for the more aggressive speculators to squeeze out the lift while it lasts. That said, the timeline is too tight. Either the Fed is wrong in its projections or the market is pricing too aggressively. Eventually, this matter will come to a head; but the cut is still a ways into the future and thereby more readily ignored by shorter-term traders.
Table of FOMC Scenario Table
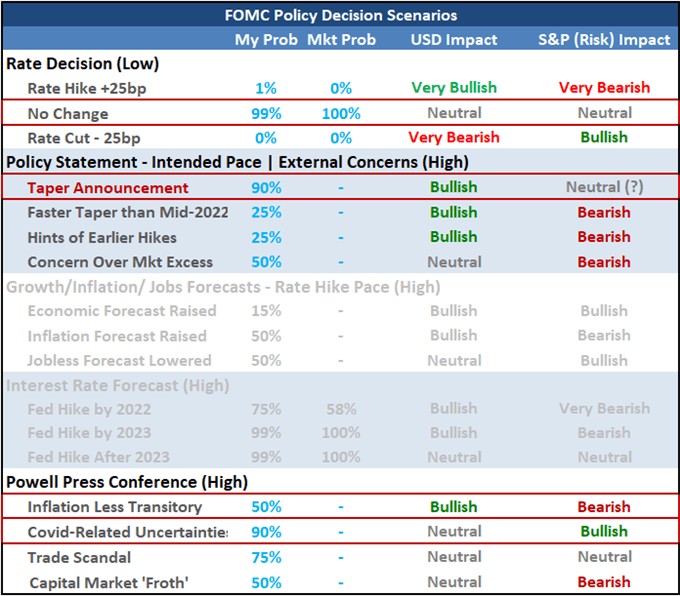
Table Created by John Kicklighter
Despite the Dollar’s waver and US indices rally after this past session’s rate decision, interest rate expectations derived from Fed Fund futures continued to charge higher after the FOMC headlines. Notably, the timing for the first Fed rate hike continues to shift forward with the CME’s Fed Watch tool boosting the probability of the first rate hike to a 65 percent hance of a June 2022 hike. This matters for more than just the Dollar – it is a serious erosion in global risk trends founded on support by external authorities like the Fed. Then again, the Fed isn’t the only driver of monetary policy-linked risk trends. The hawkish lean from the like of the Bank of Canada, Reserve Bank of Australia and Reserve Bank of New Zealand (who has already hiked) should be considered in this context.
Table of Fed Rate Probabilities
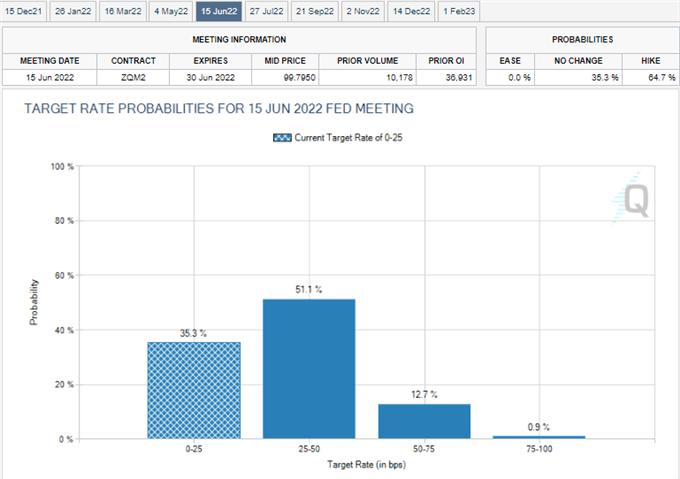
Table from CME’s FedWatch Tool on cmegroup.com
The Dollar Pair I’m Watching and Thursday’s Docket
In the wake of the Fed’s taper announcement, there was a very notable lack of progress registered by the US Dollar. This may be owing to the non-existent reaction from risk trends which would have bolstered the currency’s haven status or perhaps the hawkish move was effectively tempered by the central bank’s forward guidance. Either way, we are looking at aggressive congestion rather than a productive market resolution. It is possible that EURUSD can find its way as the most liquid pair, but I’m dubious. AUDUSD, USDCAD and NZDUSD can exercise competing hawkish policy forecasts. Yet, my interest is most piqued by USDJPY where the 15-day range carved out by the pair has narrowed quickly, while the volatility (ATR) over the same period is still charged to the point of threatening a break – even if by accident.
Chart of USDJPY with 200-Day SMA, 15-Day Range and 15-Day ATR (Daily)
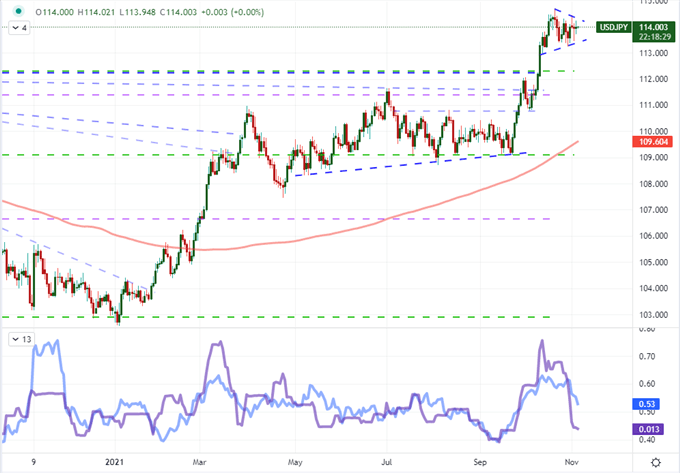
Chart Created on Tradingview Platform
For top event risk, there are a number of docket items and general themes that are worthy of our attention. The record high reading form the ISM’s US service sector activity report was all but ignored this past session in recognition of the FOMC. That is a data point that will no doubt come back into play. More immediate, the ADP private payroll beat links directly to Friday’s nonfarm payrolls which will inevitably be shaped by interest rate expectations which show two rate hikes in 2022 almost fully priced in via Fed Funds futures.
Calendar of Major Macro Event Risk for the Week
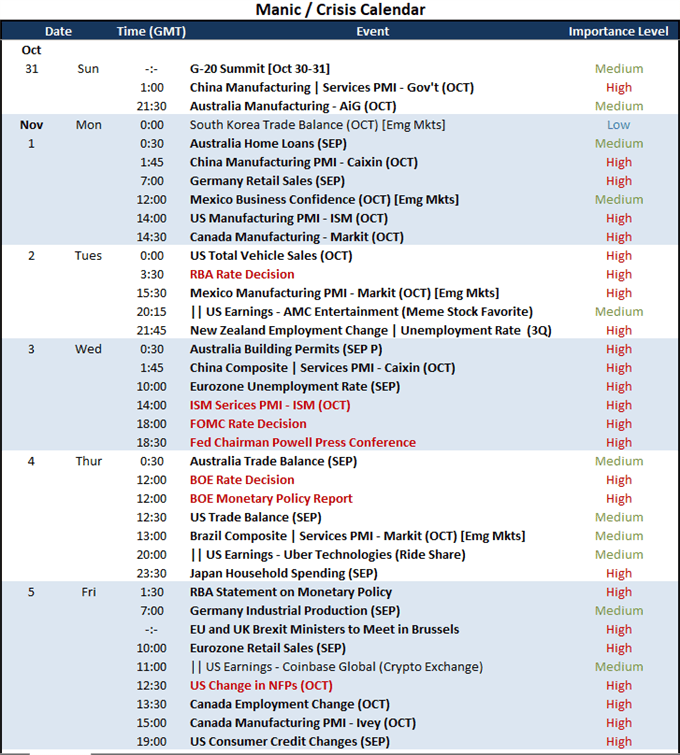
Calendar Created by John Kicklighter
Top Fundamental Themes Ahead: BOE Decision and Medium-Term Inevitabilities
Taking a closer look at the ISM activity report, we can see the context of the record high run in service sector activity. This is an encouraging reading for growth forecasts and employment in the US as this segment accounts for the majority in both accounts. What’s more, the inflation component would charge higher, but supply chain considerations are definitely a complicating factor. Traders would do well to drink in Friday’s event risk to get a sense of how this all fits into short, medium and long-term trading plans moving forward.
Chart of S&P 500 Overlaid with ISM Services and Manufacturing Activity (Monthly)
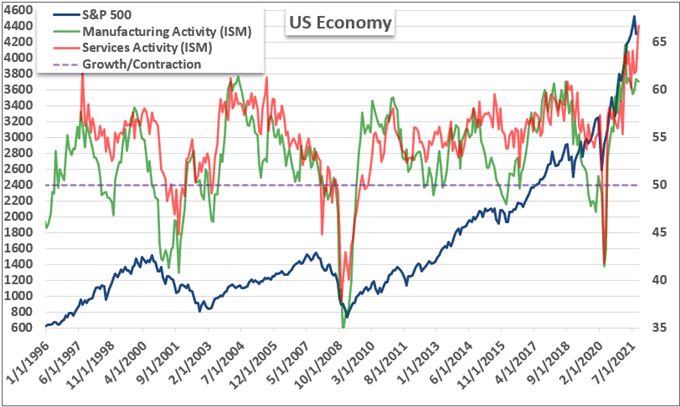
Chart Created by John Kicklighter with Data from ISM
For top absolute event risk Thursday, the Bank of England (BOE) rate decision is top consideration. Where the Fed was expected to taper, the market is tending towards a rate hike from the UK’s central bank at this meeting. The consensus from MPC members seems a mixed bag which could catch some segment of the market off-guard – thereby generating volatility – but the general assumption of action for the likes of the Fed will likely work against an overbearing move for the Sterling. If there is movement, pick your crosses wisely. GBPUSD is stuck in its own rut and EURGBP is a tethered cross. I’m still enamored by GBPJPY given its ‘risk’ influence, but GBPAUD, GBPCAD and GBPNZD can cater to the relative pacing of hawkish bearings for productive market movement.
Chart of GBPCAD with 200-Day SMA and 200-Day Disparity Index (Daily)
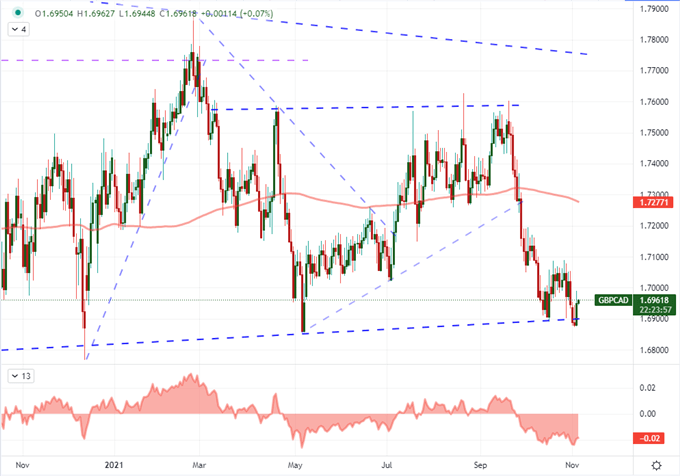
Chart Created on Tradingview Platform


