


S&P 500, Dollar, USDCNH, EURUSD, Gold Talking Points:
- The S&P 500 managed a sixth consecutive session’s advance for the longest stretch of gains in 16-month at a rapidly diminishing pace and only 1% from a record high close
- For systemic reflection, the Dollar’s tumble speaks to a possible systemic shift in reserve status; but for now, its major counterparts hit on key fundamental themes
- While some popular measures of risk appetite are climbing or at least on favorable bearing, the fastest climb since the August 2011 peak for gold suggests something is amiss
A Creep Towards Record Highs as Liquidity Drains
Despite the optimism surrounding stimulus and vaccine forecasts along with the charge from a strong NFPs this past Friday, risk appetite continues to follow a mixed path. The inconsistency will draw the attention of old hand traders who are familiar with the effects inherent in the ‘summer doldrums’. Heading deeper into the month of August, there is perhaps a natural inclination to let the typical low volatility and low liquidity conditions normal of the period sooth fears of risk already downplayed by overindulgence in speculative appetite. And yet, serious fundamental misfires continue to threaten the peace. Nevertheless, the S&P 500 – an imperfect but very indicative measure of risk taking of late – advanced for a sixth consecutive session through Friday. As is common for extended rallies for a risk-leaning asset, volatility will tend to drop. That is what we’ve seen in the five-day (one week) ATR which has hit a fresh pre-pandemic low.

Chart of S&P 500 with 50-Day Moving Average, 5-Day ATR and Consecutive Candles (Daily)
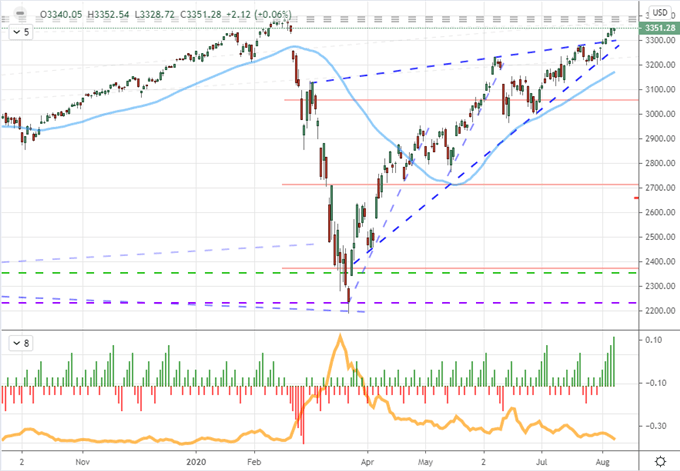
Chart Created on Tradingview Platform
Historically, the month of August is exceptionally reserved in terms of market activity. In volume terms from the S&P 500, the period averages a depressed level of liquidity with volume hitting the lowest trading-day adjusted level of any other calendar month. The VIX volatility index similarly struggles through this period with a marked correlation to liquidity. Yet, thin markets can also amplify market movement when unexpected swells occur. That is why the VIX will be one of the benchmarks that I will keep close monitor of through the coming week.
Chart of Monthly Performance in S&P 500, Volume and VIX
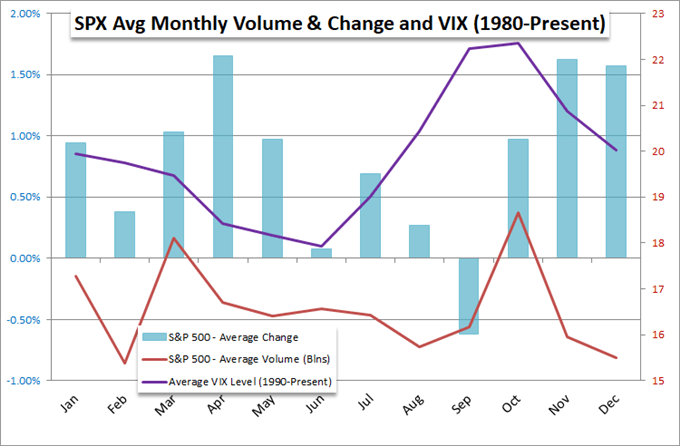
Chart Created by John Kicklighter
If there were a possibility of unexpected volatility through this past week, it would have most likely come through the influence of the July US labor report. The monthly jobs statistics are perhaps one of the most recognizable data series in the global markets, so a significant deviation from expectations is worthy of its fair share of volatility. As it happened, the figure crossed the wires with a better-than-expected 1.76 million jobs added to payrolls – a relief after the severe shortfall reported with the ADP reading. That said, enthusiasm was not following this figure in full force. There is still a long way to recovering all of the lost jobs since March, and that is a stark reminder of the contrast between market enthusiasm and economic hardship we face.
Chart of Change in US Nonfarm Payrolls and Total Employment (Monthly)
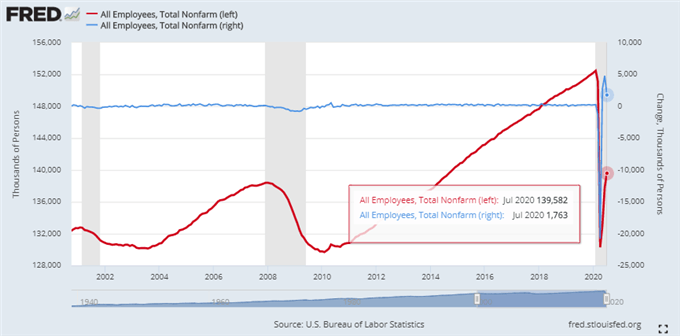
Chart from Federal Reserve Economic Database
Dollar’s Tumble Draws Attention to Many Fundamental Themes
Another key benchmark that I will be monitoring for it reflection on the broader financial system through the coming week is the US Dollar. The benchmark currency has suffered a remarkable tumble these past six weeks with key technical levels crashing along the way. While some may consider this a fall from a safe haven, I believe it is more indicative of the curb in the relative appeal of the world’s most heavily used reserve. That gives it impressive proxy powers. Consider USDCNH (Dollar-Chinese Yuan) which is a strong reflection of renewed trade war concerns. News of the executive order to push Tik Tok and We Chat from the US along with the sanctions against Hong Kong’s Chief Executive has renewed a serious fundamental throttle. Traders would do well to also keep tabs on the aluminum tariff on Canada via USDCAD.
Chart of USDCNH Overlaid with USDHKD in Green and a 20-Day Moving Average (Daily)
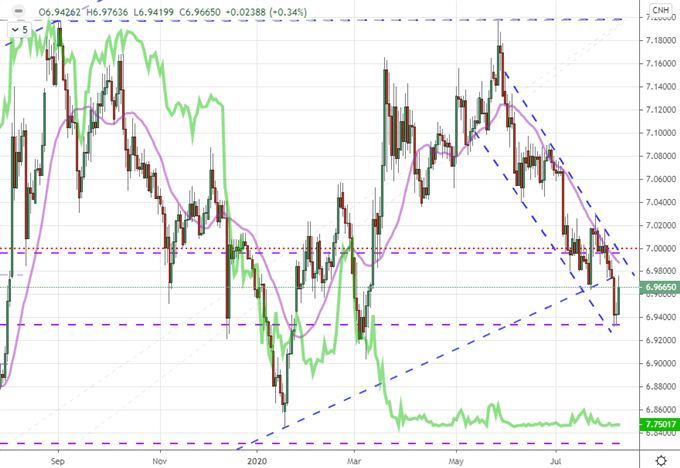
Chart Created on Tradingview Platform
There are a host of majors that are worthy of our attention moving forward. GBPUSD will deal with relative growth potential in UK GDP; the NZDUSD is on tap for the RBNZ rate decision and AUDUSD is running far afield of its typical economic motivations. Yet, there is perhaps no better reflection of the FX market and entire financial system than EURUSD. While the data is not as concentrated for this pair, the range between 1.1900 – 1.1700 is a gauge of what the perspective of reserve concerns and relative economic potential truly reflect in the broader market.
| Change in | Longs | Shorts | OI |
| Daily | -1% | -4% | -3% |
| Weekly | 4% | -10% | -5% |
Chart of EURUSD with 20, 100-Day Moving Average and COT, 100-Day Disparity (Daily)
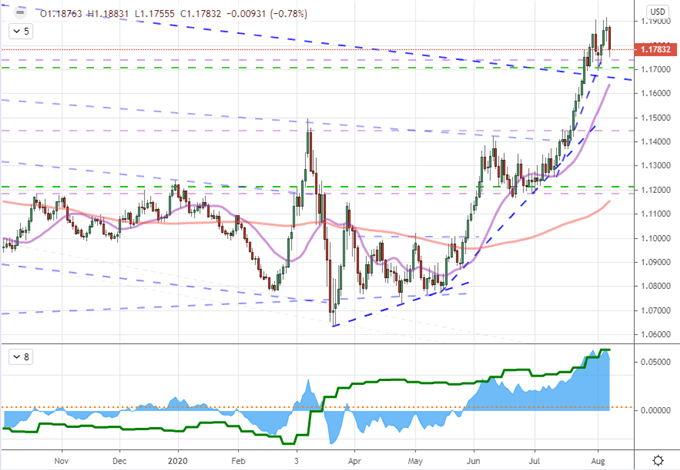
Chart Created on Tradingview Platform
Gold’s Hyperbolic Rally Has to Pause…Eventually
Finally, a top-of-list asset for me in the week ahead is gold. The precious metal has gone ‘hyperbolic’ as of late. I don’t use that word lightly, but when markets charge so quickly that spot outpaces its 50-day moving average by the widest margin since the market peaked in 2011, it is something to watch. This is an underlying safe haven in a market that is riding higher on complacency. That is a concern in itself. Yet, such a tempo as this is raising the pressure of a correction. The interest I have is how much retreat there is in a market that pulls back? Given the alternative to fiat assets role this asset plays, it would be very surprising if gold fully reverses course to a systemic bear trend.
Chart of Gold with 50-Day Moving Average
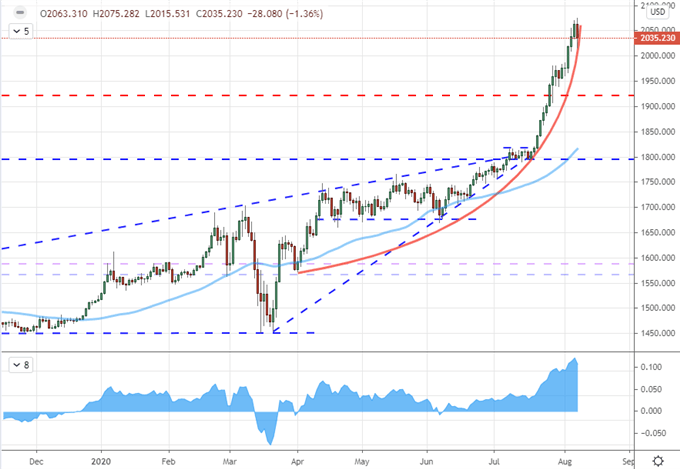
Chart Created on Tradingview Platform

If you want to download my Manic-Crisis calendar, you can find the updated file here.
.


