


Gold Technical Price Outlook: XAU/USD Near-term Trade Levels
- Gold price updated technical trade levels – Daily & Intraday Charts
- XAU/USD breaks monthly opening-range lows- testing critical uptrend support
- New to Gold Trading? Get started with this Free How to Trade Gold -Beginners Guide
Gold prices are up 1.2% since the start of the week with XAU/USD rebounding off critical uptrend support into the open – the focus is on possible exhaustion on this near-term recovery and while the broader outlook remains constructive, the risk remains for a deeper setback while below 1850. These are the updated targets and invalidation levels that matter on the XAU/USD technical charts. Review my latest Strategy Webinar for an in-depth breakdown of this gold technical setup and more.
Gold Price Chart - XAU/USD Daily
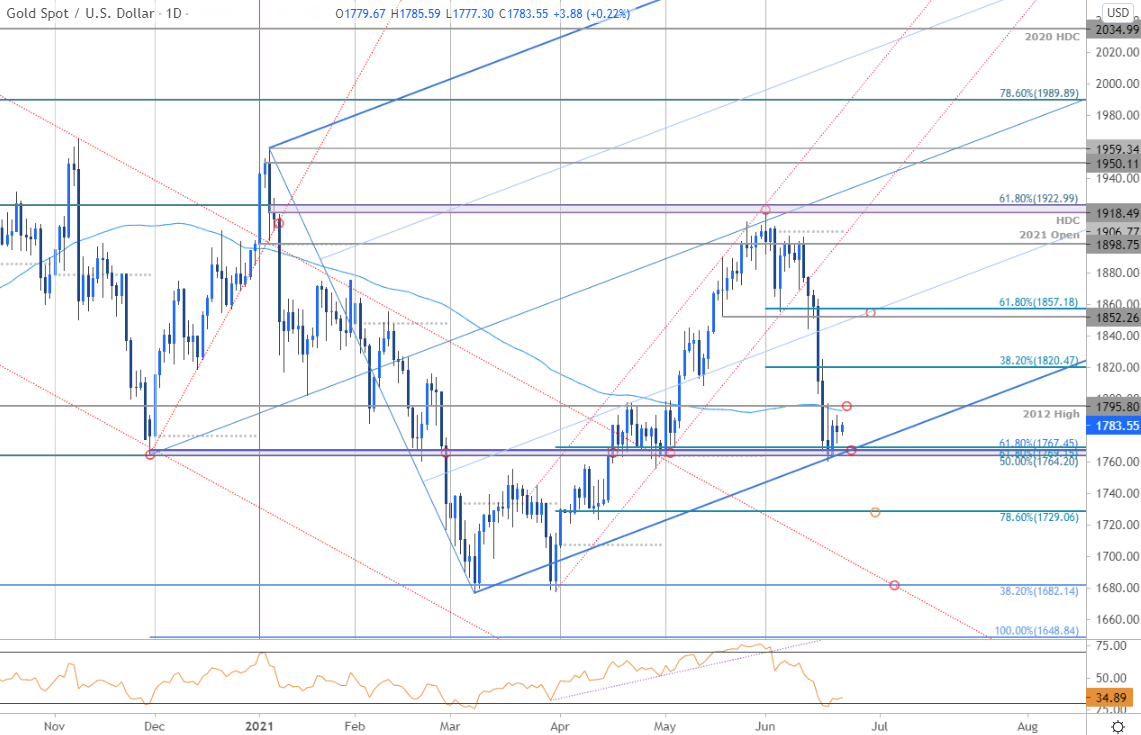
Chart Prepared by Michael Boutros, Technical Strategist; Gold on Tradingview
Technical Outlook: In my last Gold Price Outlook we noted that XAU/USD, “monthly opening-range is set just below confluence resistance – breakout to offer guidance.” The post-FOMC breakdown saw prices plummet through the June range-lows with gold rebounding off confluence support early in the week at 1764-69- a region defined by the 50% retracement of the 2020 advance, the 61.8% Fibonacci extension of the 2020 decline and the 61.8% retracement off the March rally. Note that this threshold also converges on trendline support and break / close below is needed to mark resumption with the immediate decline vulnerable while above.
Gold Price Chart - XAU/USD 240min
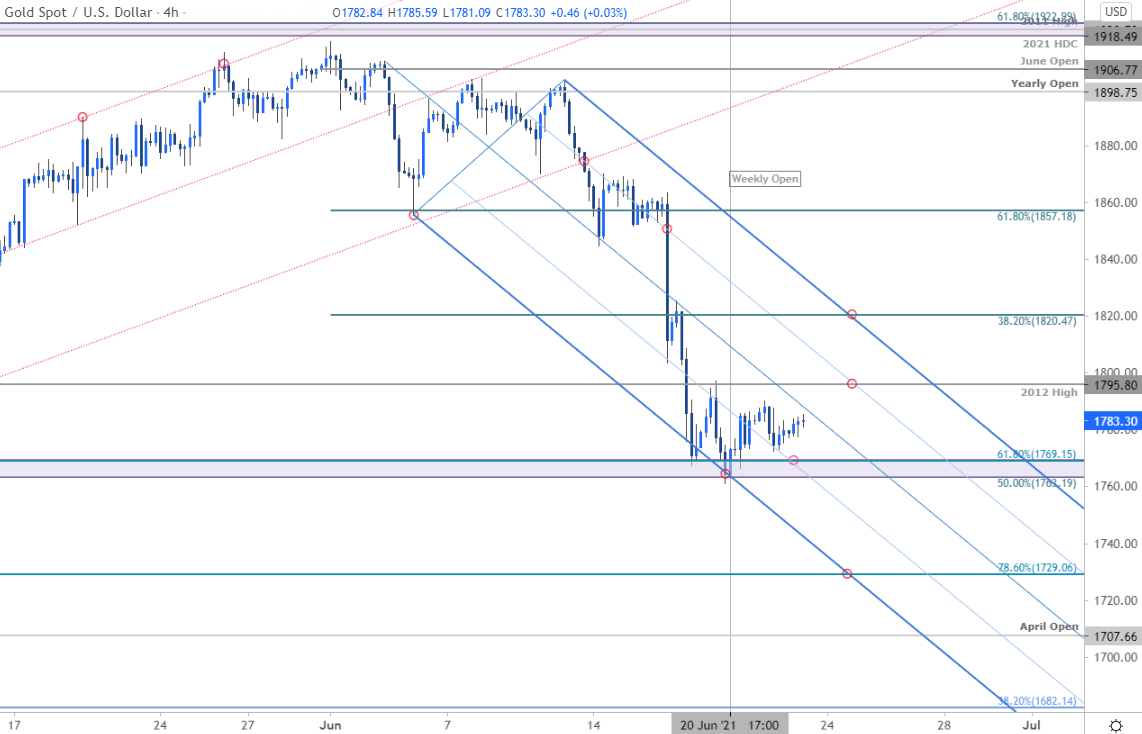
Notes: A closer look at Gold price action shows XAU/USD trading within the confines of a descending pitchfork formation with the decline rebounding off the lower parallel into the weekly open. Initial resistance stands at the 2012 high at 1795 backed by near-term bearish invalidation at 1820. A break below this key threshold exposes subsequent support objectives at 1729, the April open at 1707 and the 38.2% retracement of the 2015 advance at 1682.

Bottom line: Gold plunged into a critical uptrend support and the focus is on a reaction off this threshold. From at trading standpoint, a good zone to reduce short-exposure /lower protective stops- look for topside exhaustion ahead of the upper parallel IF price is indeed heading lower with a break / close below 1763 needed to fuel the next leg lower. Ultimately, a XAU/USD would need to breach above the 61.8% retracement of the monthly range at 1857 to mark resumption of the broader uptrend. Stay nimble heading into key US inflation data on Friday with Core Price Consumption Expenditure (PCE) likely to fuel some volatility here. Review my latest Gold Weekly Price Outlook for a closer look at the longer-term XAU/USD technical trading levels.
For a complete breakdown of Michael’s trading strategy, review his Foundations of Technical Analysis series on Building a Trading Strategy
Gold Trader Sentiment – XAU/USD Price Chart
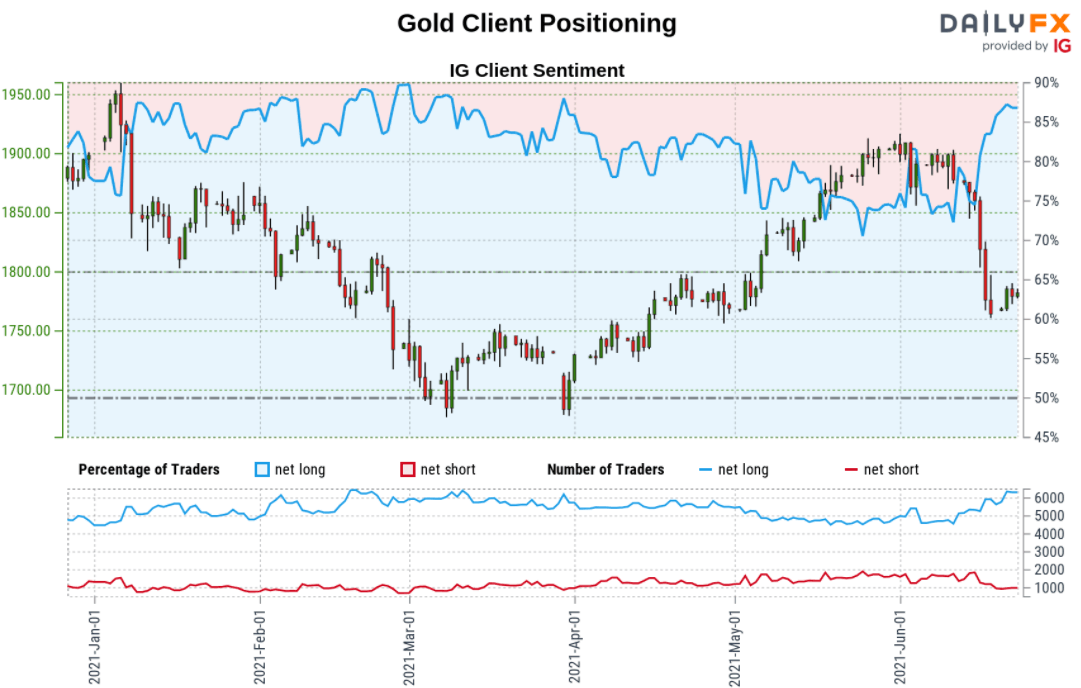
- A summary of IG Client Sentiment shows traders are net-long Gold- the ratio stands at +6.12 (85.96% of traders are long) – typically bearishreading
- Long positions are1.89% higher than yesterday and 18.78% higher from last week
- Short positions are4.03% lower than yesterday and 45.08% lower from last week
- We typically take a contrarian view to crowd sentiment, and the fact traders are net-long suggests Gold prices may continue to fall. Traders are further net-long than yesterday and last week, and the combination of current positioning and recent changes gives us a stronger Gold-bearish contrarian trading bias from a sentiment standpoint.
| Change in | Longs | Shorts | OI |
| Daily | 1% | -3% | -1% |
| Weekly | 2% | -8% | -2% |
---
Active Technical Setups
- US Dollar Outlook: DXY Surges as FOMC Fuels Major USD Breakout
- Bitcoin (BTC/USD) Outlook: Bitcoin Post-Collapses Counter-Offensive
- Canadian Dollar Outlook: USD/CAD at Support- Loonie Breakout Imminent
- Euro Price Outlook: EUR/USD Rips into Yearly Open Resistance
- Oil Price Outlook: Crude Surges- Bulls Eye Major Breakout at May High
- Written by Michael Boutros, Technical Strategist with DailyFX
Follow Michael on Twitter @MBForex


