


Bitcoin Technical Price Outlook: BTC/USD Trade Levels
- Bitcoin updated technical trade level– Daily & Intraday Charts
- BTC/USD plunges towards key support at 30655- resistance / bearish invalidation 41930
- What is Bitcoin? Understand Bitcoin as a Cryptocurrency
Bitcoin prices plummeted a staggering 53% from the record highs in April with the sell-off responding to downtrend support. Yesterday marked the third test of this critical support zone and while the broader outlook remains ominous from a technical backdrop, the immediate decline may be vulnerable here with the bears at risk in the near-term. These are the updated targets and invalidation levels that matter on the BTC/USD technical price charts. Review my latest Strategy Webinar for an in-depth breakdown of this Bitcoin setup and more.
Bitcoin Price Chart – BTC/USD Daily
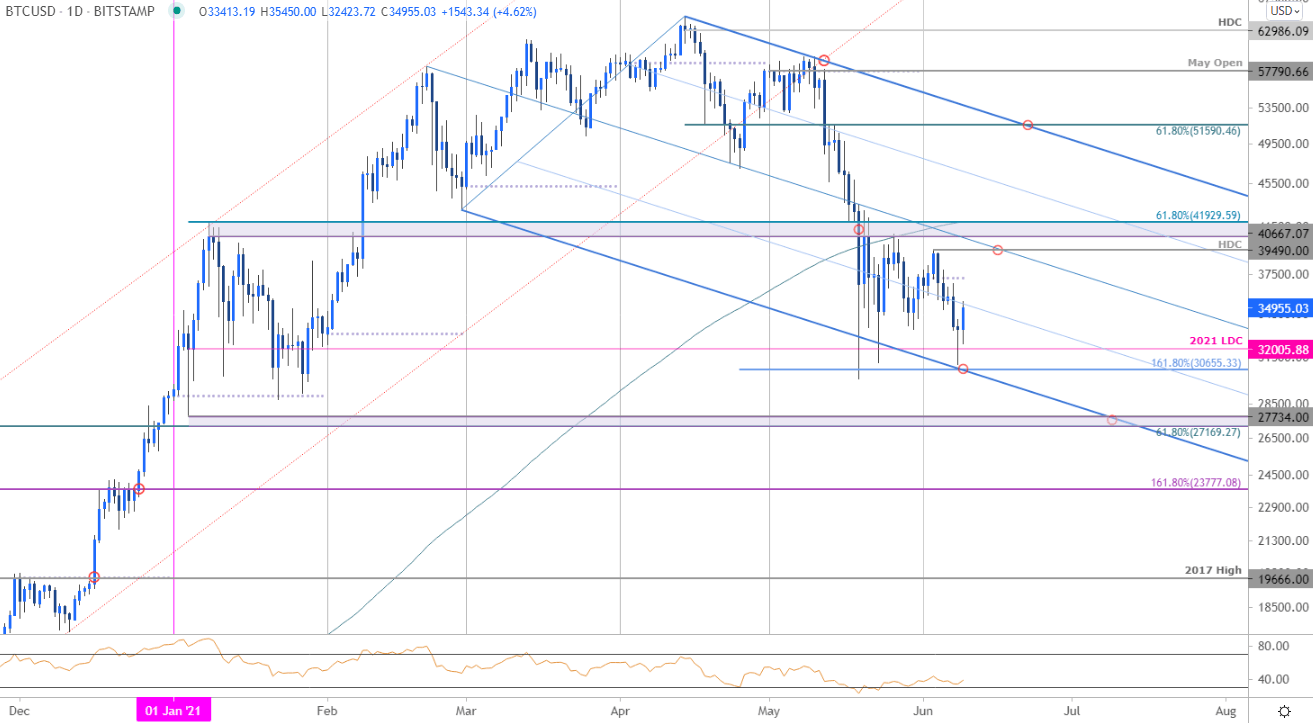
Chart Prepared by Michael Boutros (log scale), Technical Strategist; Bitcoin on Tradingview
Technical Outlook: In last month’s Crypto Price Outlook we noted that Bitcoin had broken below a critical support barrier at, “40667-41929 with the move also taking out the 200-day moving average for the first time since April 2020 and marking the largest single-day range (ATR) in BTC/USD . The sell-off was halted in early US Trade at the 1.618% extension / 2021 low-day close at 30655-32005 – this support zone remains critical. Likely to see some chop here in the days ahead with bearish invalidation now lowered to the median-line / 40667-41930.” Over the past three weeks since, Bitcoin has tested the bounds of this key range four times with price reversing just pips ahead 30655. BTC/USD is up more than 10% off the lows already and keeps the broader focus on this critical range break.
Bitcoin Price Chart – BTC/USD 240min
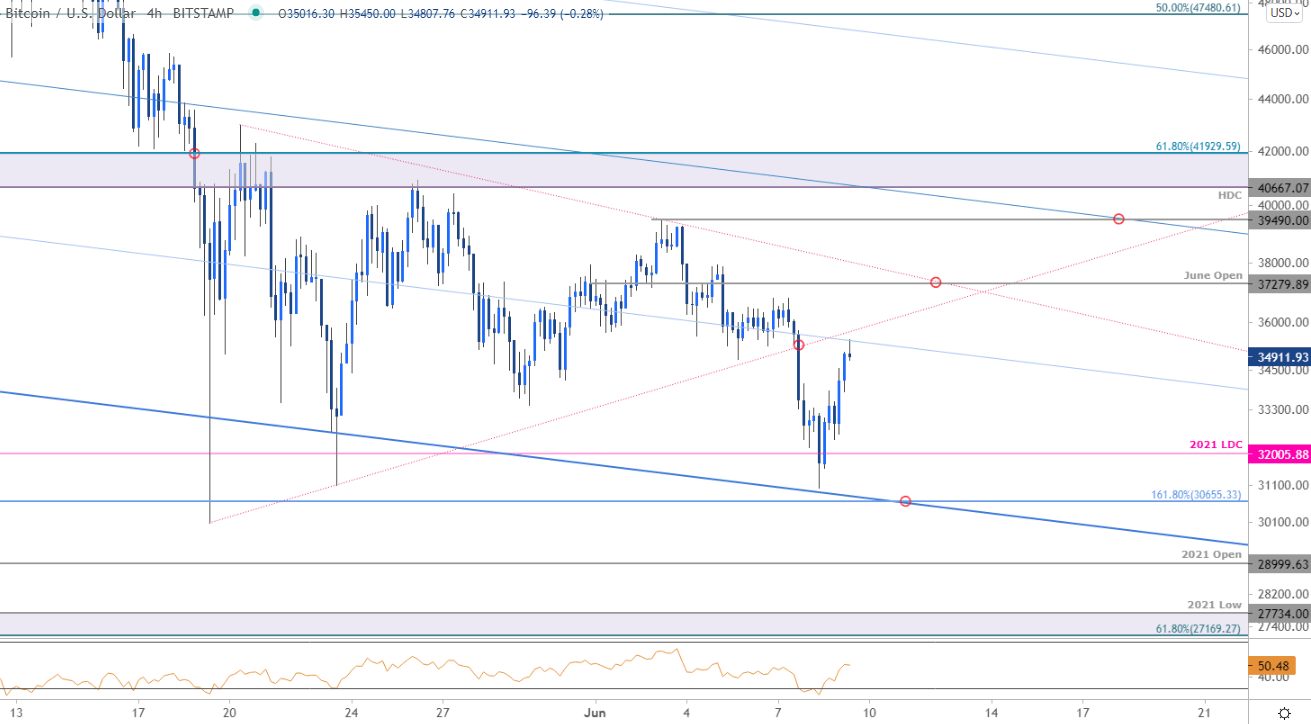
Notes: A closer look at Bitcoin price action shows BTC/USD trading within the confines of an descending pitchfork formation extending off yearly highs. Yesterday’s rebound off the lower parallel has Bitcoin targeting initial resistance at the June Open at 37280 with the objective monthly opening-range highs just beyond at 39490. Broader bearish invalidation remains with the 61.8% Fibonacci retracement of the yearly-to-date 2021 range / 200day moving average at 41930. Initial support steady at the yearly low-day close at 32005 with a break below 30655 needed to mark resumption of the broader downtrend towards subsequent support objective at the 2021 yearly open 28999 and the 61.8% retracement of the 2020 rally / yearly opening-range low at 27169/734.

Bottom line: Bitcoin has rebounded off confluence downtrend support- the immediate focus is on this recovery. From at trading standpoint, look for topside exhaustion ahead of 39490 IF price is indeed heading lower with a break / close below 30655 needed to mark resumption. Ultimately, a breach / close above 41930 would be needed to validate a broader reversal pattern with such a scenario exposing downtrend resistance, currently near ~45500.
For a complete breakdown of Michael’s trading strategy, review his Foundations of Technical Analysis series on Building a Trading Strategy
---
Active Technical Setups
- Canadian Dollar Outlook: USD/CAD at Support- Loonie Breakout Imminent
- Euro Price Outlook: EUR/USD Rips into Yearly Open Resistance
- Gold Price Outlook: Gold Surges as Crypto Crumbles– XAU/USD Breakout Levels
- Oil Price Outlook: Crude Surges- Bulls Eye Major Breakout at May High
- S&P 500 Price Outlook: Bull-Market Correction or More? CPI on Tap
- Written by Michael Boutros, Currency Strategist with DailyFX
Follow Michael on Twitter @MBForex


