


US Dollar Technical Price Outlook: DXY Near-term Trade Levels
- US Dollar updated technical trade levels – Daily & Intraday Charts
- USD Post- Fed breakout testing major Fibonacci hurdle at uptrend resistance
- Support eyed at 91.39, constructive above 91 - Key resistance 91.95 (inflection zone)
The US Dollar Index has surged more than 2.6% off the May lows with the post- FOMC breakout fueling a rally to fresh multi-month highs. The advance is now approaching the first major hurdle into confluent uptrend resistance and we’re looking for a reaction on a stretch higher for guidance with the broader outlook constructive while above the 91-handle. These are the updated technical targets and invalidation levels that matter on the US Dollar price chart heading into the close of the week. Review my latest Strategy Webinar for an in-depth breakdown of this DXY technical setup and more.
US Dollar Index Price Chart – DXY Daily
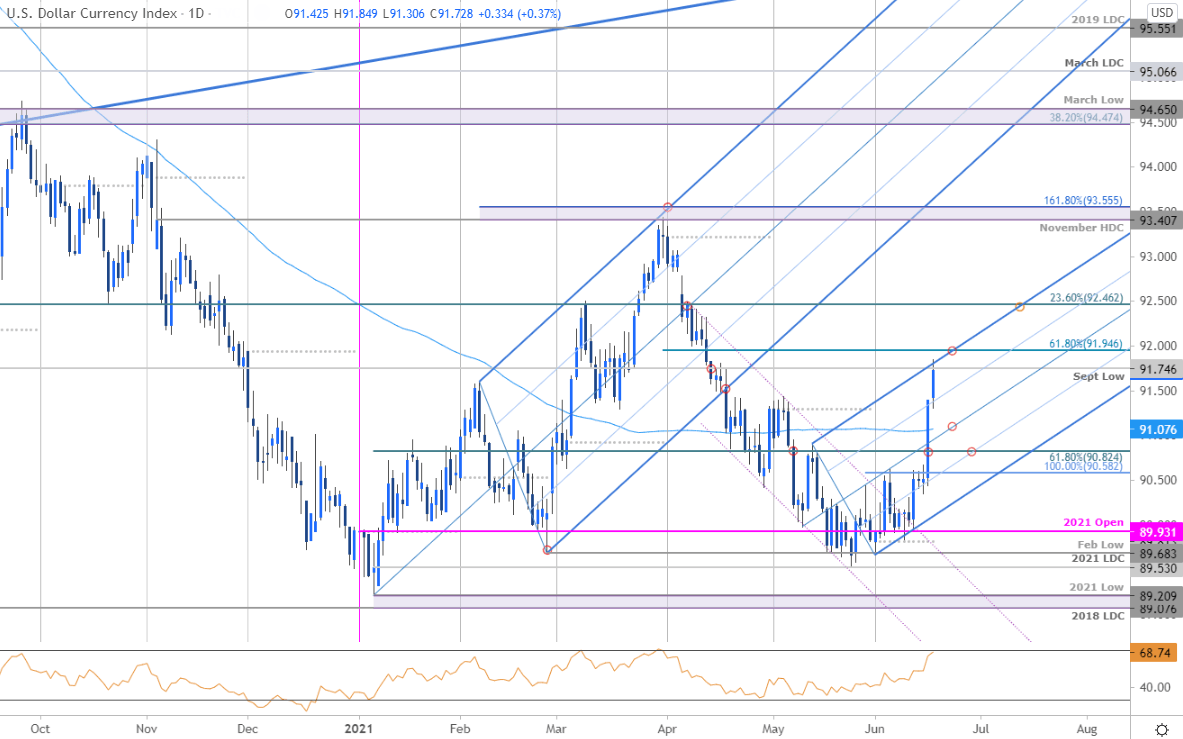
Chart Prepared by Michael Boutros, Technical Strategist; US Dollar Index on Tradingview
Technical Outlook: In last month’s US Dollar Price Outlook we noted that the USD, “sell-off has stalled with the index threatening a weekly doji off objective yearly open support. From at trading standpoint, a good region to reduce short-exposure / lower protective stops.” DXY spent five-weeks testing critical support at 89.93 with numerous attempts failing to mark a single weekly close below.
Yesterday’s FOMC-induced rally fueled a breakout above the weekly / monthly opening-range highs with the advance now targeting key resistance at the 61.8% Fibonacci retracement of the late-March decline at 91.95- the immediate advance may be vulnerable while below this threshold. Daily support rests with the median-line / 100-day moving average near the 91-handle with bullish invalidation now raised to 90.58.
US Dollar Index Price Chart – DXY 240min
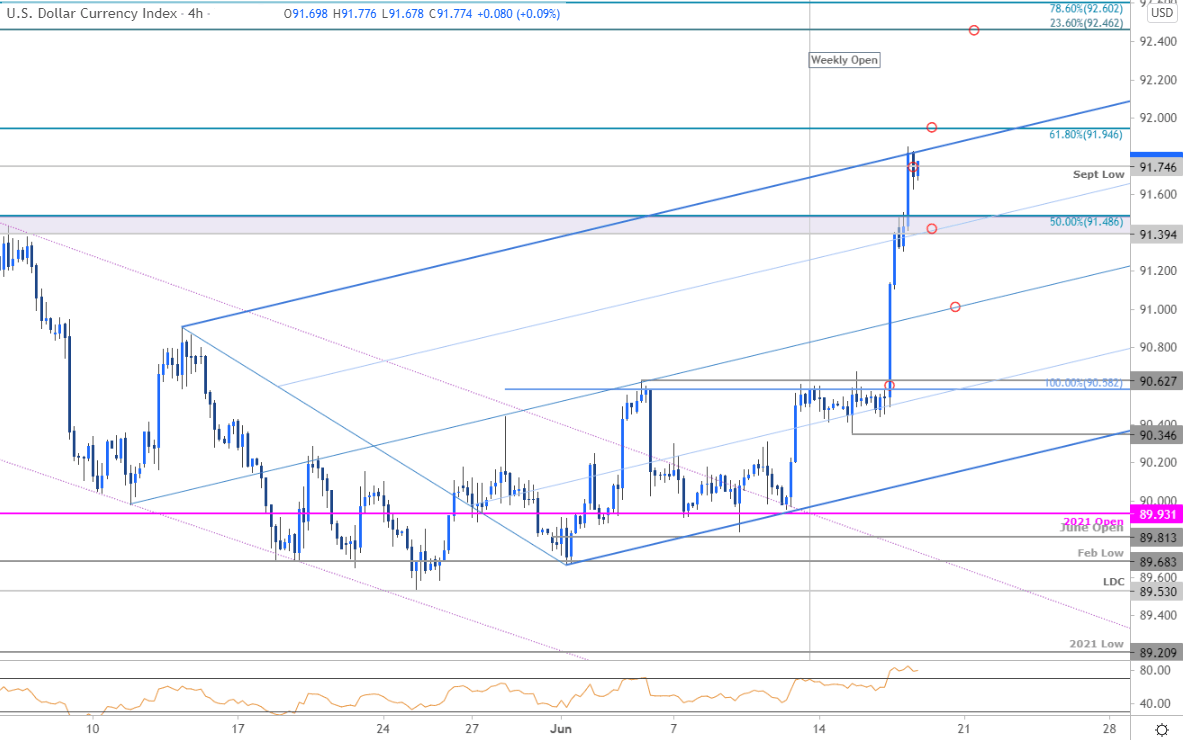
Notes: A closer look at DXY price action shows the index probing the upper parallel today in early US trade with the 61.8% retracement just higher. Initial support now rests back at 91.39/48 backed by the median line – both levels of interest for possible downside exhaustion IF reached. A topside breach / close above 91.95 would be needed to fuel the next leg higher in the greenback with such a scenario exposing subsequent resistance objectives at 92.46 and 92.60.

Bottom line: The US Dollar Fed-breakout may be vulnerable into key Fibonacci resistance just higher. From a trading standpoint, look to reduce long-exposure / raise protective stops on a stretch towards the 92-handle – losses should be limited by the median-line IF price is indeed heading higher with a topside breach likely to fuel another accelerated run. Review my latest US Dollar Weekly Price Outlook for an in-depth look at the longer-term DXY technical trade levels.
For a complete breakdown of Michael’s trading strategy, review his Foundations of Technical Analysis series on Building a Trading Strategy
---
Key US Economic Data Releases
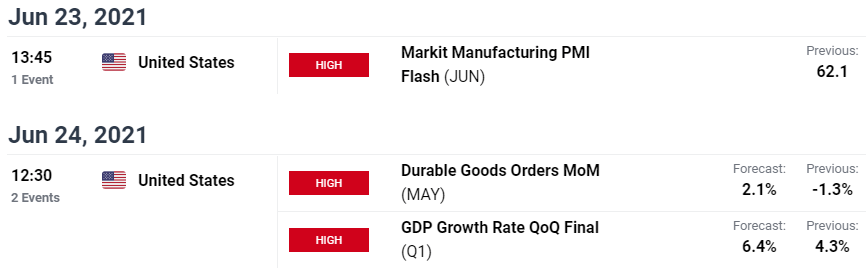
Economic Calendar - latest economic developments and upcoming event risk.
Active Technical Setups
- Gold Price Outlook: Gold Pops on Hot Inflation- Bulls Eyes Resistance
- Bitcoin (BTC/USD) Outlook: Bitcoin Post-Collapses Counter-Offensive
- Canadian Dollar Outlook: USD/CAD at Support- Loonie Breakout Imminent
- Euro Price Outlook: EUR/USD Rips into Yearly Open Resistance
- Oil Price Outlook: Crude Surges- Bulls Eye Major Breakout at May High
- Written by Michael Boutros, Currency Strategist with DailyFX
Follow Michael on Twitter @MBForex


