


Japanese Yen Technical Price Outlook: USD/JPY Weekly Trade Levels
- Japanese Yen technical trade levels update – Weekly Chart
- USD/JPY breakout extends into confluent trend resistance
- Constructive while above 107.31 – Key resistance at 109.68/92
The Japanese Yen virtually unchanged against the US Dollar this week with the USD/JPY breakout stalling into trend resistance early in the session. All eyes now turn to key central bank interest rate decisions from the Federal Reserve and the Bank of Japan this week with the broader USD/JPY rally vulnerable near-term. These are the updated targets and invalidation levels that matter on the USD/JPY weekly price chart heading into tomorrow’s highly anticipated FOMC rate decision. Review my latest Weekly Strategy Webinar for an in-depth breakdown of this Yen technical setup and more.
Japanese Yen Price Chart – USD/JPY Weekly

Chart Prepared by Michael Boutros, Technical Strategist; USD/JPY on Tradingview
Notes: In last month’s Japanese Yen Weekly Price Outlook we highlighted that, “A breakout of the March downtrend has been validated with the USD/JPY rally now approaching initial resistance objectives just higher.” Price continued to rip through resistance targets all throughout the month with the advance now testing a more significant, technical slope confluence near ~109.20s- a region defined by the upper parallel of the ascending pitchfork formation extending off the late-2020 / 2021 lows and the longer-term descending slope extending off the 2017 high. Key lateral resistance stands just higher at the confluence of the 2019 objective yearly open and the 50% retracement at 109.68/92 – the rally may be vulnerable into these levels.
Initials weekly support rests at the 75% parallel (currently ~108) backed by the 2017 swing low at 107.31- losses should be limited to the median-line IF USD/JPY is indeed heading higher on this stretch. A topside breach above 109.92 would likely fuel another accelerated rally for the Dollar with such a scenario exposing subsequent resistance objective at the 2019/2020 high-week closes at 111.53/60.

For a complete breakdown of Michael’s trading strategy, review his Foundations of Technical Analysis series on Building a Trading Strategy
Bottom line:The USD/JPY breakout has matured with the rally now testing confluence uptrend resistance – the immediate long-bias may be vulnerable while below 109.68/92. From a trading standpoint, a good zone to reduce long-exposure / raise protective stops- be on the lookout for topside exhaustion into this resistance zone. Ultimately a larger pullback may offer more favorable entries with a breach above this formation shifting the focus back towards 111.Stay nimble here and watch the weekly close with the FOMC and BoJ interest rate decisions likely to fuel some serious volatility in the days ahead. I’ll publish and updated Japanese Yen Price Outlook once we get further clarity on the near-term USD/JPY technical trade levels.
Japanese Yen Trader Sentiment – USD/JPY Price Chart
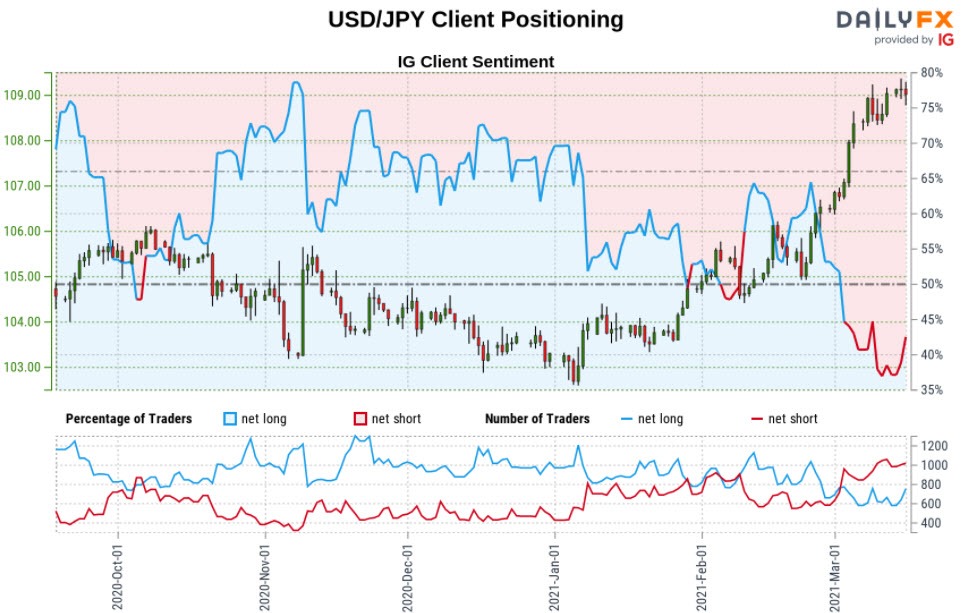
- A summary of IG Client Sentiment shows traders are net-short USD/JPY - the ratio stands at -1.63 (38% of traders are long) – bullish reading
- Long positions are16.05% lower than yesterday and 1.51% lower from last week
- Short positions are 7.78% higher than yesterday and 3.79% higher from last week
- We typically take a contrarian view to crowd sentiment, and the fact traders are net-short suggests USD/JPY prices may continue to rise. Traders are further net-short than yesterday and last week, and the combination of current positioning and recent changes gives us a stronger USD/JPY-bullish contrarian trading bias from a sentiment standpoint.
| Change in | Longs | Shorts | OI |
| Daily | -16% | 5% | 0% |
| Weekly | 20% | -13% | -8% |
---
Key US / Japan Data Releases
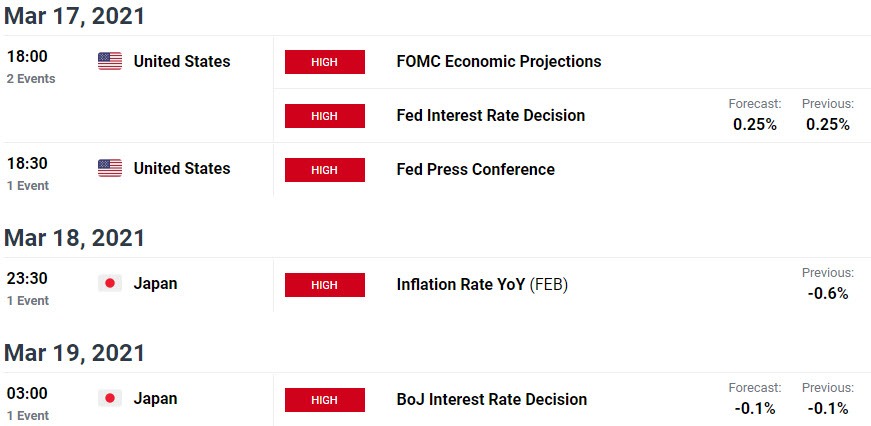
Economic Calendar - latest economic developments and upcoming event risk.
Previous Weekly Technical Charts
- Euro (EUR/USD)
- Sterling (GBP/USD)
- US Dollar (DXY)
- Gold (XAU/USD)
- Australian Dollar (AUD/USD)
- Sterling (GBP/USD)
- Canadian Dollar (USD/CAD)

--- Written by Michael Boutros, Technical Currency Strategist with DailyFX
Follow Michael on Twitter @MBForex


