


Sterling Technical Price Outlook: GBP/USD Weekly Trade Levels
- Sterling technical trade level update – Weekly Chart
- GBP/USD rebound keeps monthly opening-range in focus heading into Fed/BoE
- Key resistance into the 1.43-handle – Support 1.3743, broader bullish invalidation 1.35
The British Pound snapped a two-week losing streak this week with Sterling paring nearly half of the 3.26% decline seen off the February highs. Despite the recent advance, the threat remains for a deeper correction in the days ahead as we look to major event risk on tap next week. These are the updated targets and invalidation levels that matter on the GBP/USD weekly technical chart heading into the FOMC / BoE interest rate decisions. Review my latest Strategy Webinar for an in-depth breakdown of this Cable trade setup and more.
Sterling Price Chart - GBP/USD Weekly
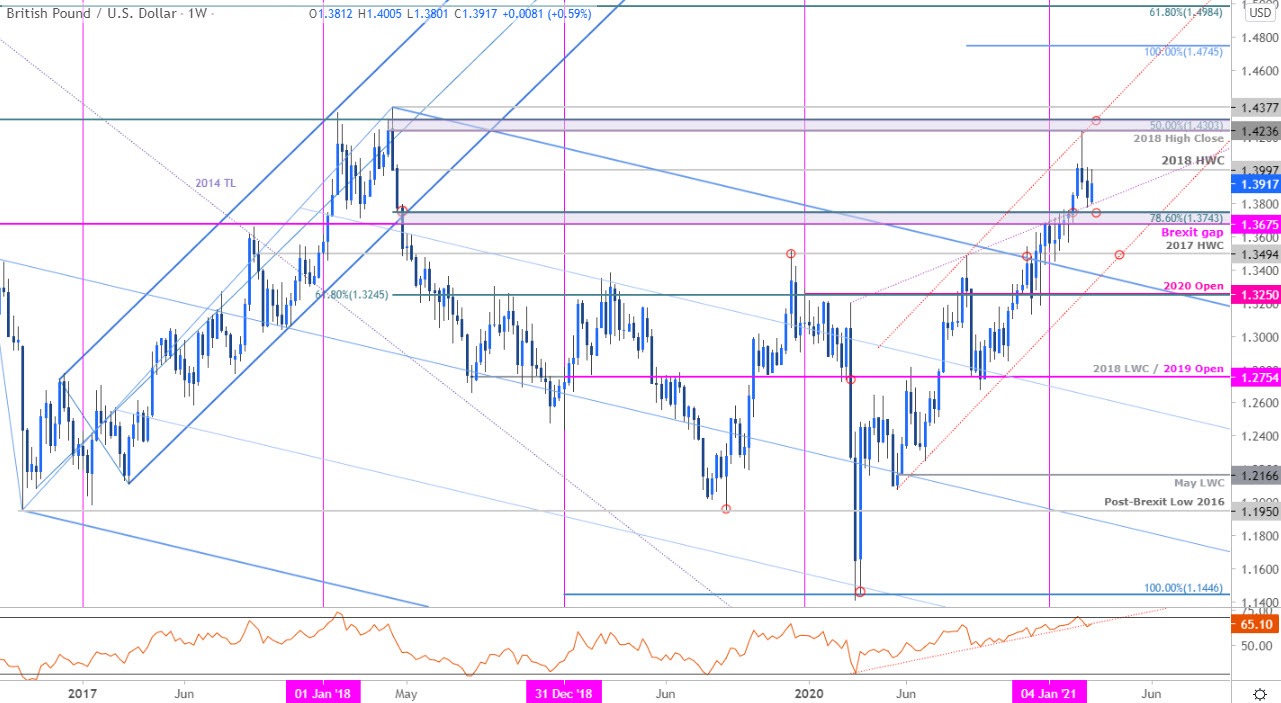
Chart Prepared by Michael Boutros, Technical Strategist; GBP/USD on Tradingview
Notes:In my last Sterling Weekly Price Outlook we noted that the GBP/USD, “breakout may be vulnerable in the weeks ahead after reversing sharply off technical uptrend resistance.” The British Pound fell more than 3% off those highs before rebounding this week off former slope resistance extending off the March 2020 highs. Note that a pending support trigger in weekly momentum remains in focus.
Initial literal support steady at 1.3675-1.3743 – look for inflection off this zone with a break / close below keeping the focus on confluence support at the May 2020 trendline / 2017 high-week close at 1.3494(area of interest for possible downside exhaustion IF reached). Initial resistance unchanged at 1.3997 (2018 high-week close) backed by the 2018 high-close / 50% retracement of the 2014 decline at 1.4236-1.4303- a breach / close above this threshold would be needed to mark resumption of the broader advance with such a scenario exposing 1.4377 and longer-term topside objectives into the 100% extension at 1.4745.
For a complete breakdown of Michael’s trading strategy, review his Foundations of Technical Analysis series on Building a Trading Strategy
Bottom Line:The Sterling correction off the yearly highs may not yet be complete and heading into next week’s FOMC / BoE rate decisions, the focus remains on possible topside exhaustion ahead of the yearly high-day close at 1.4138 IF price is indeed heading lower. Ultimately, a deeper correction may offer more favorable opportunities with a breach / close above the 1.43-handle threatening a much larger Sterling advance.

Sterling Trader Sentiment - GBP/USD Price Chart
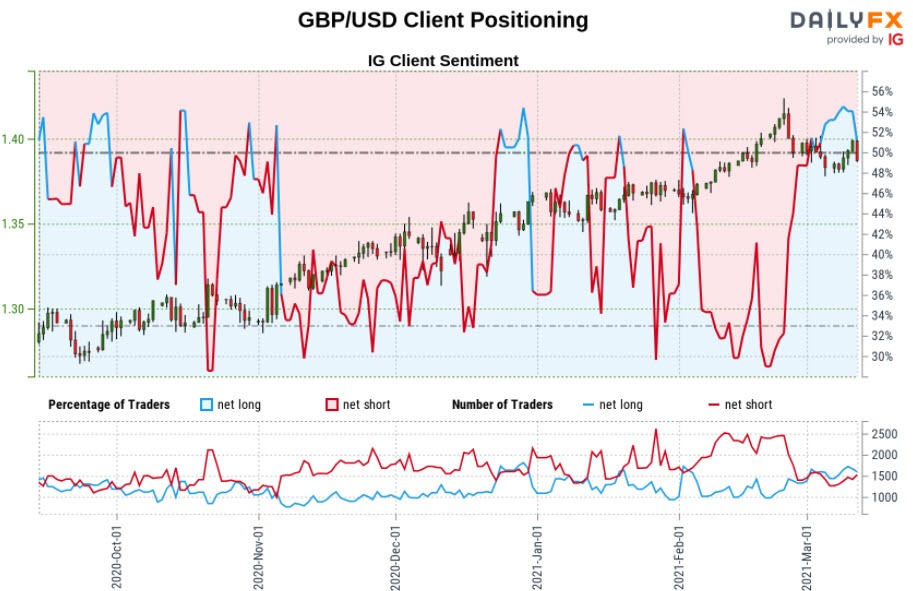
- A summary of IG Client Sentiment shows traders are net-long GBP/USD - the ratio stands at +1.14 (53.33% of traders are long) – neutral reading
- Long positions are7.33% lower than yesterday and 7.08% higher from last week
- Short positions are4.13% lower than yesterday and 6.14% higher from last week
- We typically take a contrarian view to crowd sentiment, and the fact traders are net-long suggests GBP/USD prices may continue to fall. Yet traders are less net-long than yesterday but more net-long from last week and the combination of current positioning and recent changes gives us a further mixed GBP/USD trading bias sentiment standpoint.
| Change in | Longs | Shorts | OI |
| Daily | -3% | -7% | -4% |
| Weekly | 10% | -16% | 1% |
---
Key UK / US Economic Data Releases
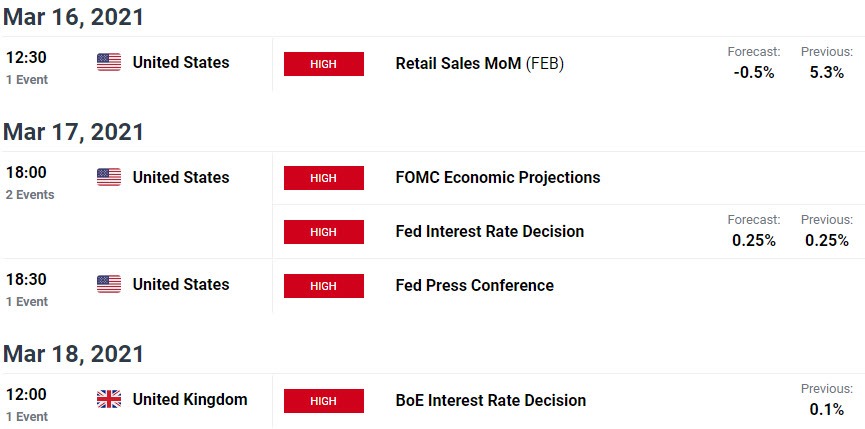
Economic Calendar - latest economic developments and upcoming event risk.
Previous Weekly Technical Charts
- US Dollar (DXY)
- Gold (XAU/USD)
- Sterling (GBP/USD)
- Canadian Dollar (USD/CAD)
- Crude Oil (WTI)
- Euro (EUR/USD)
- Japanese Yen (USD/JPY)

--- Written by Michael Boutros, Technical Currency Strategist with DailyFX
Follow Michael on Twitter @MBForex


