


Sterling Technical Price Outlook: GBP/USD Trade Levels
- Sterling technical trade level update – Daily & Intraday Charts
- GBP/USD carves July opening-range just above support– breakout to offer guidance
- Key support 1.3646/75- near-term bearish invalidation 1.3941.
The British Pound is fractionally lower against the US Dollar with GBP/USD off 0.22% into the open of US trade on Wednesday. An outside-day reversal off trend resistance yesterday takes Sterling back towards key support and the monthly opening-range is set heading into the close of the week. These are the updated targets and invalidation levels that matter on the GBP/USD price charts. Review my latest Weekly Strategy Webinar for an in-depth breakdown of this Sterling technical setup and more.
Sterling Price Chart – GBP/USD Daily
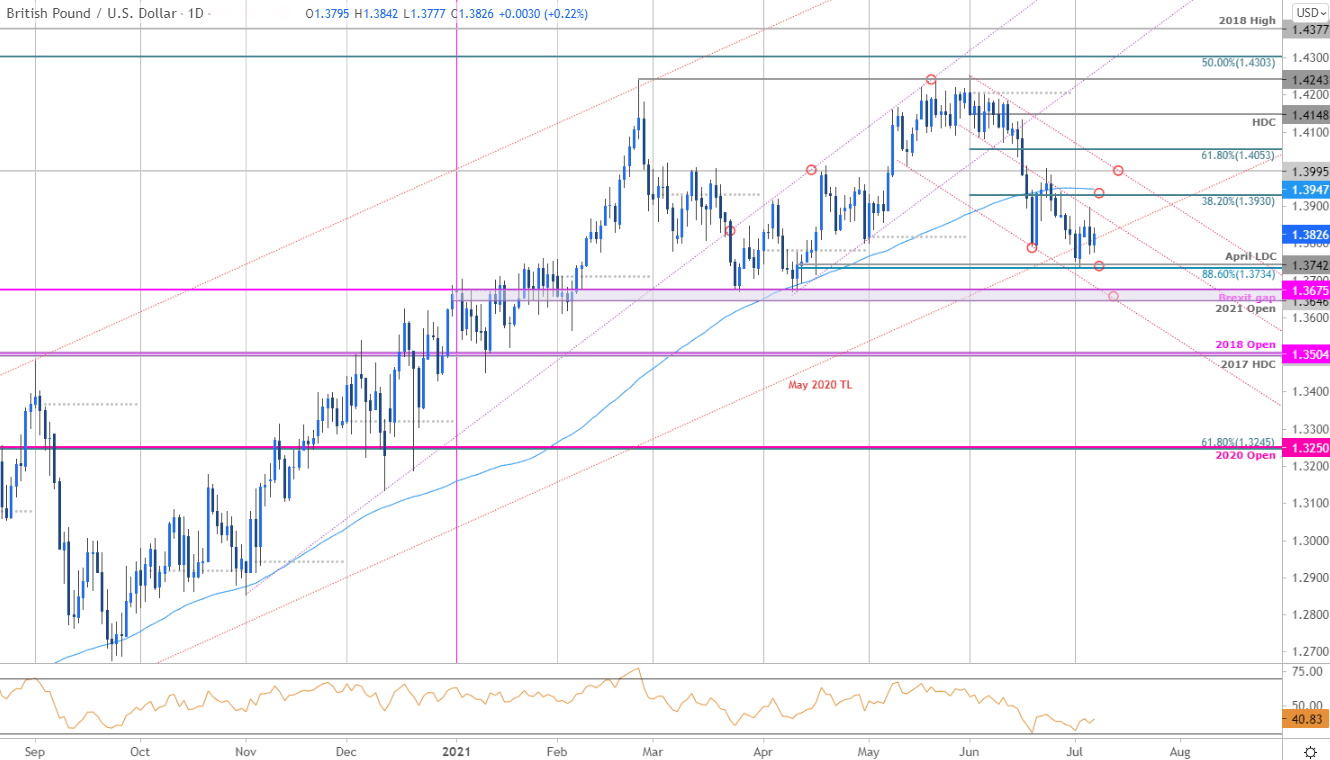
Chart Prepared by Michael Boutros, Technical Strategist; GBP/USD on Tradingview
Technical Outlook: Sterling is carving out the July opening-range just above technical support at 1.3734/42- a region defined by the 88.6% Fibonacci retracement and the April low-day close. Note that a possible five-wave decline has been identified off the yearly highs and highlights the risk for a near-term correction / recovery in the British Pound. Outside-day reversals off the monthly lows & highs have already granted merit to this range and we’re on breakout watch in the days ahead. Critical support rests just lower at the confluence of the yearly open / March & April lows / Brexit gap-level at 1.3646/75 – a break / close below this threshold would likely fuel another bout of accelerated losses with such a scenario exposing the 1.35-handle.
Sterling Price Chart – GBP/USD 120min
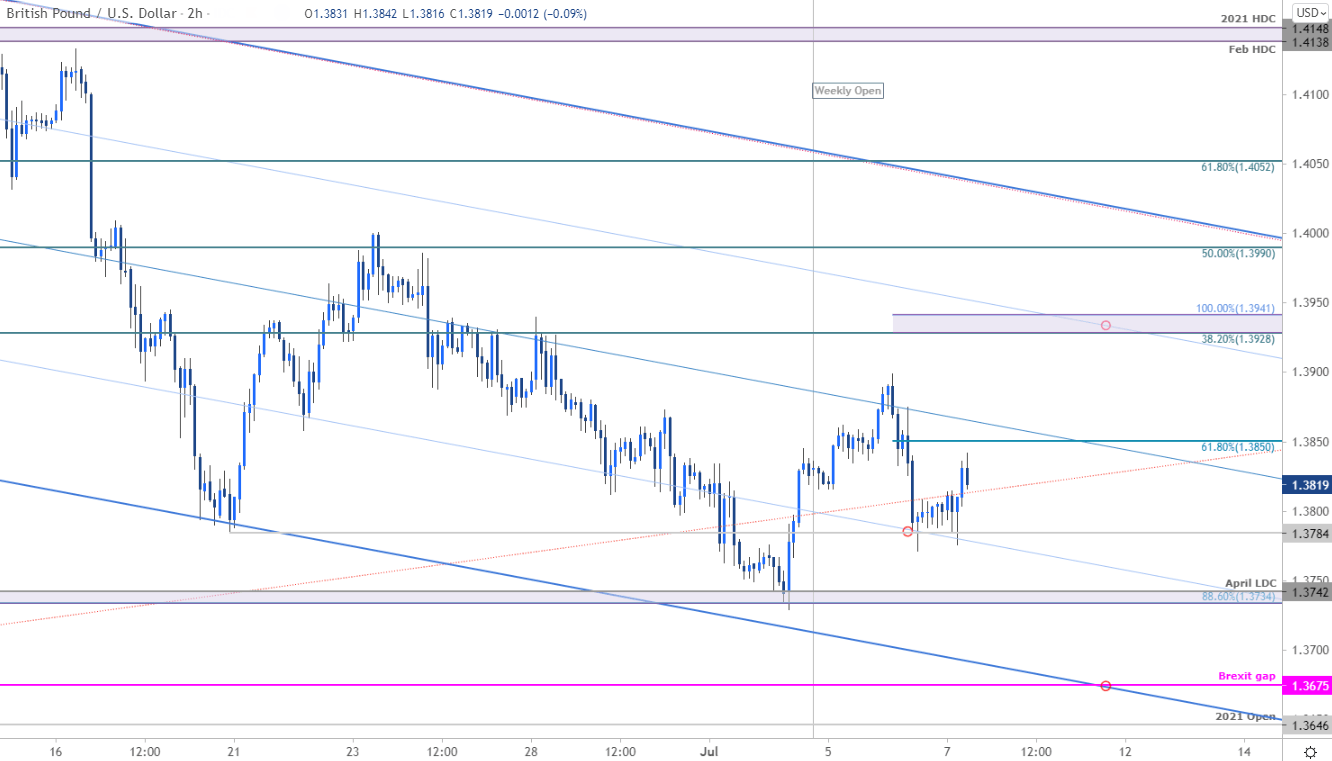
Notes: A closer look at Sterling price action shows GBP/USD trading within the confines of a descending pitchfork formation with the weekly opening range taking shape just above the June low at 1.3784. Initial support rests at 1.3734/42 – look for inflection there IF reached with a break keeping the focus on 1.3675 & the yearly open at 1.3646 (both regions of interest for possible downside exhaustion). Initial resistance stands at 1.3850 with a breach above 1.3928/42 needed to suggest a more significant low is in / reversal is underway.

Bottom line: Sterling has set the monthly opening-range just above a technical support confluence with key support just lower into the 2021 yearly open- on the lookout for a larger exhaustion low this month. From at trading standpoint, look for topside exhaustion ahead of 1.3928/41 with a move lower here exposing key support into the lower parallel- watch for a larger reaction there IF reached. Review my latest British Pound Weekly Price Outlook for a closer look at the longer-term GBP/USD technical trade levels.
For a complete breakdown of Michael’s trading strategy, review his Foundations of Technical Analysis series on Building a Trading Strategy
Sterling Trader Sentiment – GBP/USD Price Chart
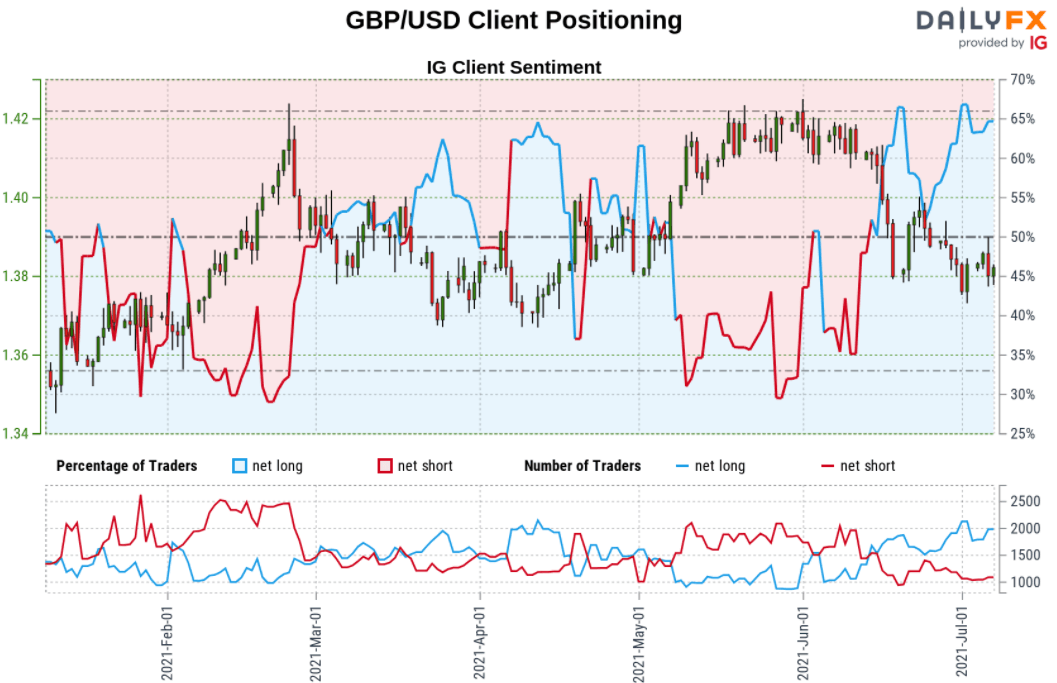
- A summary of IG Client Sentiment shows traders are net-long GBP/USD - the ratio stands at +1.67 (62.59% of traders are long) – typically bearish reading
- Long positions are11.46% higher than yesterday and 6.96% higher from last week
- Short positions are5.13% higher than yesterday and 0.97% higher from last week
- We typically take a contrarian view to crowd sentiment, and the fact traders are net-long suggests GBP/USD prices may continue to fall. Traders are further net-long than yesterday and last week, and the combination of current sentiment and recent changes gives us a stronger GBP/USD-bearish contrarian trading bias from a sentiment standpoint.
| Change in | Longs | Shorts | OI |
| Daily | 3% | -7% | -3% |
| Weekly | 4% | -10% | -5% |
---
UK / US Economic Calendar
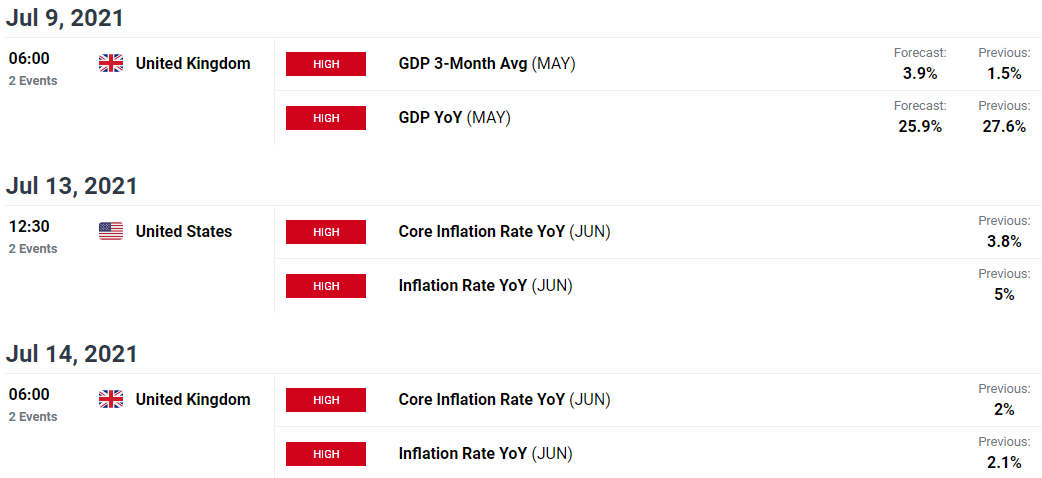
Economic Calendar - latest economic developments and upcoming event risk.
Active Technical Setups
- Canadian Dollar Outlook: USD/CAD Battle Lines Drawn- July Loonie Levels
- Euro Price Outlook: Euro Pop Setting Up for a Drop- EUR/USD Levels
- Gold Price Outlook: Gold Plunges into Critical Support- XAU/USD Levels
- US Dollar Outlook: DXY Surges as FOMC Fuels Major USD Breakout
- Bitcoin (BTC/USD) Outlook: Bitcoin Post-Collapses Counter-Offensive
- Written by Michael Boutros, Currency Strategist with DailyFX
Follow Michael on Twitter @MBForex


