


Australian Dollar Technical Price Outlook: AUD/USD Weekly Trade Levels
- Australian Dollar technical trade level update - Weekly Chart
- AUD/USD turns from key technical resistance confluence
- Aussie key resistance steady 7531/42, Support 7385, 7293 (critical)
The Australian Dollar is under pressure against the US Dollar this week with AUD/USD attempting to mark a second consecutive weekly decline. A reversal off confluent technical resistance shifts the focus to downtrend support and threatens further losses in the days ahead- all eyes on the weekly close. These are the updated targets and invalidation levels that matter on the AUD/USD weekly price chart heading into key employment data tonight. Review my latest Weekly Strategy Webinar for an in-depth breakdown of this Aussie technical setup and more.
Australian Dollar Price Chart – AUD/USD Weekly
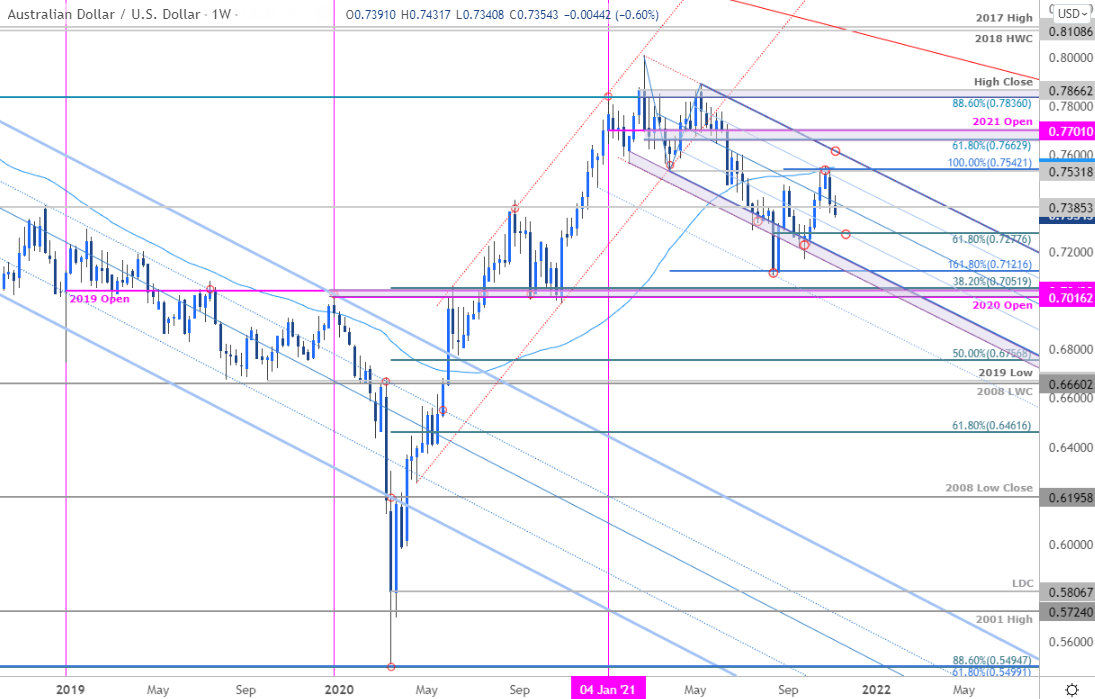
Chart Prepared by Michael Boutros, Technical Strategist; AUD/USD on Tradingview
Notes: In last month’s Australian Dollar Weekly Price Outlook we noted that the AUD/USD rally was approaching the, “next major resistance objective at the March swing lows / 52-week moving average / 100% extension at 7531/42– area of interest for possible topside exhaustion IF reached.” Aussie spent nearly three-weeks testing this threshold with price registering an intraday high at 7555 before reversing sharply lower. AUD/USD has plunged more than 2.8% off the highs with the decline taking price back below the median-line. Is a near-term high in place?
The immediate focus is on the weekly close with respect to the May low-week close at 7385- a break below this threshold would keep the focus on the 61.8% Fibonacci retracement of the August advance – which converges on the 25% parallel at ~7293- look for a larger reaction there IF reached. Key resistance remains with the April low / 100% extension / 52-wek moving average at 7531/48 with a breach / close above the upper parallel needed to suggest a more significant trend reversal is underway.

Bottom line: The Australian Dollar rally faltered at confluent resistance last week with the pullback now attempting to break back below downtrend support. From a trading standpoint, a good zone to reduce short exposure / lower protective stops – rallies should be capped by the monthly open at 7506 IF price is heading lower with a close below this lateral pivot zone needed to fuel the next leg towards the 73-handle. Stay nimble heading into Australia’s employment report later tonight. I’ll publish an updated Australian Dollar Price Outlook once we get further clarity on the near-term AUD/USD technical trade levels.
For a complete breakdown of Michael’s trading strategy, review his Foundations of Technical Analysis series on Building a Trading Strategy
Australian Dollar Trader Sentiment – AUD/USD Price Chart
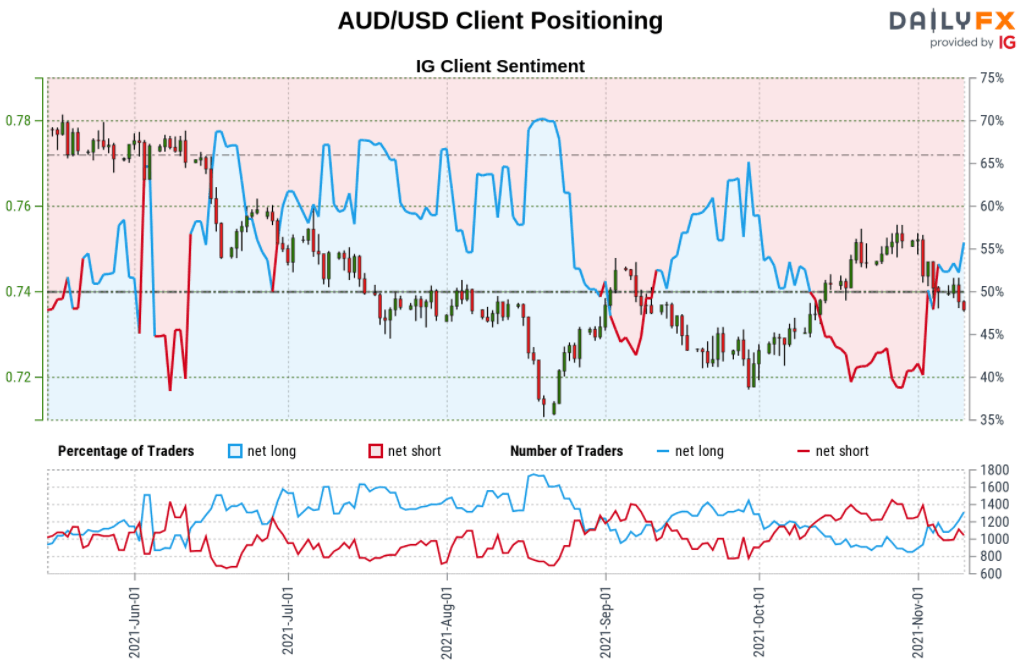
- A summary of IG Client Sentiment shows traders are net-long AUD/USD - the ratio stands at +1.18 (54.05% of traders are long) – neutral reading
- Long positions are 7.56% higher than yesterday and 9.54% higher from last week
- Short positions are1.94% lower than yesterday and 8.92% lower from last week
- We typically take a contrarian view to crowd sentiment, and the fact traders are net-long suggests AUD/USD prices may continue to fall. Traders are further net-long than yesterday and last week, and the combination of current positioning and recent changes gives us a stronger AUD/USD-bearish contrarian trading bias from a sentiment standpoint.
| Change in | Longs | Shorts | OI |
| Daily | 2% | 3% | 2% |
| Weekly | 29% | -46% | 0% |
---
Key Australia / US Data Releases

Economic Calendar - latest economic developments and upcoming event risk.
Previous Weekly Technical Charts
- Canadian Dollar (USD/CAD)
- US Dollar Index (DXY)
- Gold (XAU/USD)
- Sterling (GBP/USD)
- Euro (EUR/USD)
- Japanese Yen (USD/JPY)
- Crude Oil (WTI)
--- Written by Michael Boutros, Technical Currency Strategist with DailyFX
Follow Michael on Twitter @MBForex


