


Indices Technical Forecast: Bearish
- US equities continued their descent through the first-half of the week, finding support at key technical areas in each of the S&P, Nasdaq and Dow, which was then followed by a late-week rally that was faded aggressively at the Friday close.
- The Friday NFP release was solid all-around and provides little evidence of weakness in the US labor market that may compel a faster-than-expected pivot from the FOMC.
- The analysis contained in article relies on price action and chart formations. To learn more about price action or chart patterns, check out our DailyFX Education section.

US equities continued to sell-off this week, keeping with the trend that re-sparked at Chair Powell’s speech at Jackson Hole. And, bigger picture, the argument can be made that the bearish theme started even ahead of that speech and, perhaps even in anticipation of that speech; but ever since the S&P 500 tagged the 200 day moving average, matters have been shifting in US equities.
The ‘buy the dip’ crowd still seems to be out in force, however, as witnessed by the flare of strength on the Friday open, following what seemed to be a fairly- solid NFP report. And that showed up after a mid-session reversal on Thursday that took place after the S&P 500 had found a confluent spot of support on the chart.
In my opinion, we won’t have a bottom in US equity markets until that buy the dip crowd is silent. Because, at this point, it does seem that the long side of equities is ‘fighting the Fed’ and with clear pronouncements from Fed members on the topic, like saying that they’re ‘happy’ to see the market sell-off after Chair Powell’s speech, the desired path forward for the Fed seems to be pretty clear, they want asset prices lower.
The common question is ‘why’ and this can be drawn back to the fight against inflation. I talked about this at length in the equity forecast two weeks ago. The last period that saw inflation at this level was the late-70’s when the US economy was mired in stagflation. How we got there was very similar to how the current situation was produced, by a FOMC that was afraid of harming growth by hiking rates too aggressively. So, the Arthur Burns-led Federal Reserve slowly hiked rates, only for inflation to continue picking up and by 1980, CPI in the US was at a whopping 13.5%.
To finally arrest inflation, the newly-appointed head of the Federal Reserve knew that he had to target the excess reserves in the system and the main drive there would be accomplished by hiking interest rates. In 1980, when CPI was at 13.5%, Volcker raised Fed Funds to as high as 20%. This incentivized capital flows towards rates-based investments and within a few years, inflation had tamed and markets were back to ‘normal.’ But, rates had to be hiked over inflation for this to happen, a prospect that seems daunting by today’s standard.
Also of issue: A 20% Fed Funds may simply be an impossibility here, considering the global repercussions of what a move like that could bring. The consequences to emerging markets would be enormous. And not to mention debt service in the US, which is now carrying a debt-to-GDP ratio of 137.5% whereas it was sub-40% during Volcker’s tenure. This makes the idea of debt service a major quandary and it further highlights just how important it is for the Fed to get inflation tamed soon, and this is illustrated in the verbiage around the bank at Jackson Hole and elsewhere.
This was the reason for calling bearish US equities my Top Trade last quarter, and then again for this quarter. And with bears re-taking control of the situation, the forecast for US equities will be set to bearish for the week ahead.

S&P 500
The S&P 500 found support on Thursday at a key spot on the chart, just above the 3900 level. This area had both the 23.6% retracement of the 2022 sell-off (at 3915) and the 61.8% retracement of the bounce move at 3902 (from the June low to August high). There’s also a trendline projection nearby which can be found by connecting the lows from June and July.
I had highlighted this area on Thursday in the S&P 500 Forecast Ahead of Non-Farm Payrolls and it was in-play a few hours later.
The bounce that it produced was somewhat robust as of market open on Friday, following some bullish price action after the NFP report. But, the psychological level at 4k, along with a prior price action swing at 4016 proved too much to overcome and buyers failed to breakout there, which led to another run of bearish momentum.
At this point, the stage is set for another test at that confluent support for next week. A break-below 3900 opens the door for what could be an eventual re-test of the June lows. Along the way, there’s support potential around a prior price action swing at 3820 and then a Fibonacci level around 3786.
S&P 500 Daily Chart
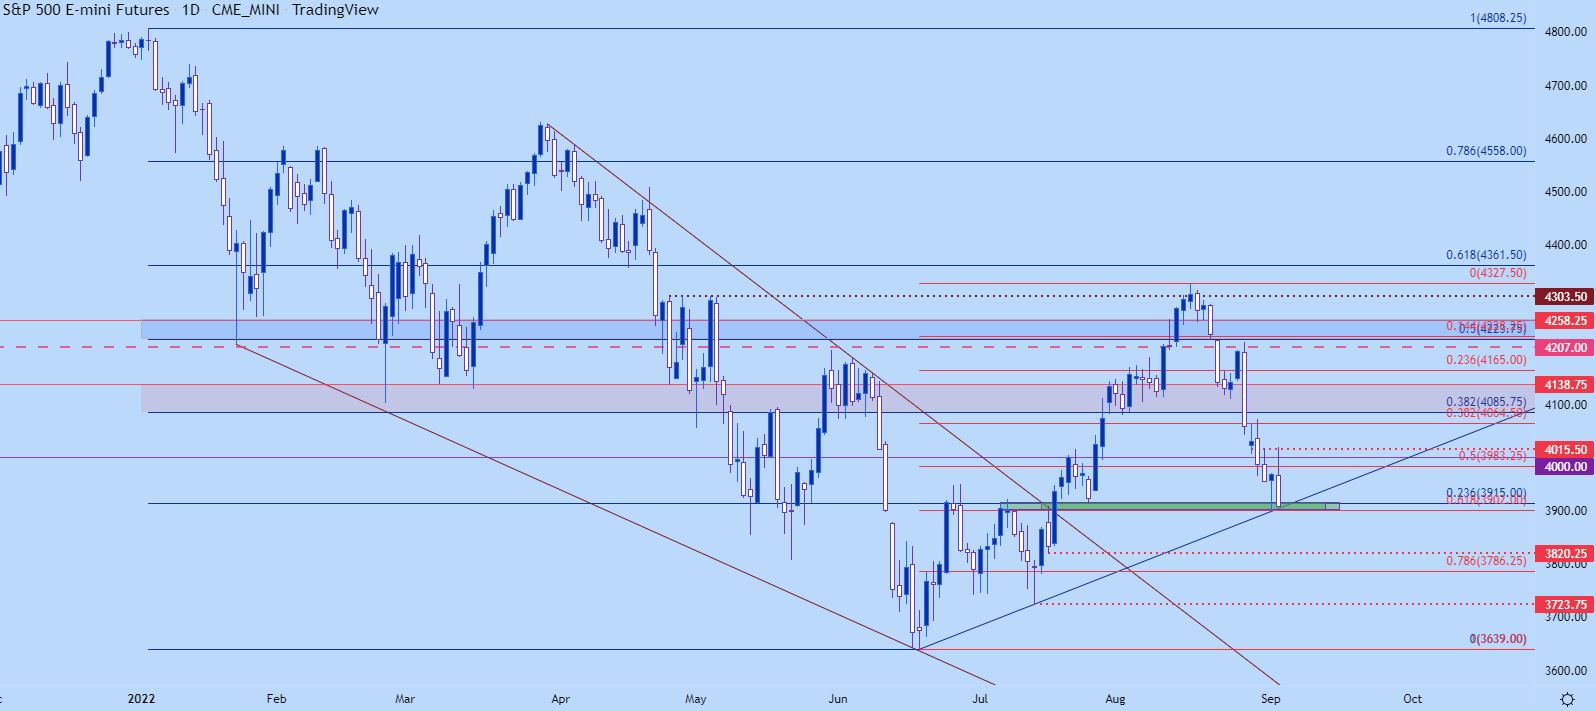
Chart prepared by James Stanley; S&P 500 on Tradingview
Nasdaq 100
While the S&P 500 found support at the 61.8% retracement of the bounce move this week, so did the Nasdaq albeit with a bit more tension. That level sits at 12,089 and while it was tested on Thursday, it didn’t allow for a four hour body to close through it, which led to a support bounce into the 50% marker of that same major move.
That 50% marker of the shorter-term move is also nearby the 23.6% retracement of the 2022 sell-off, making for a confluent area on the chart that buyers weren’t able to hold above after that NFP-fueled rally. This remains as key resistance into next week, and it could possibly even serve as an invalidation level for shorter-term bearish themes.

Nasdaq 100 Four-Hour Chart
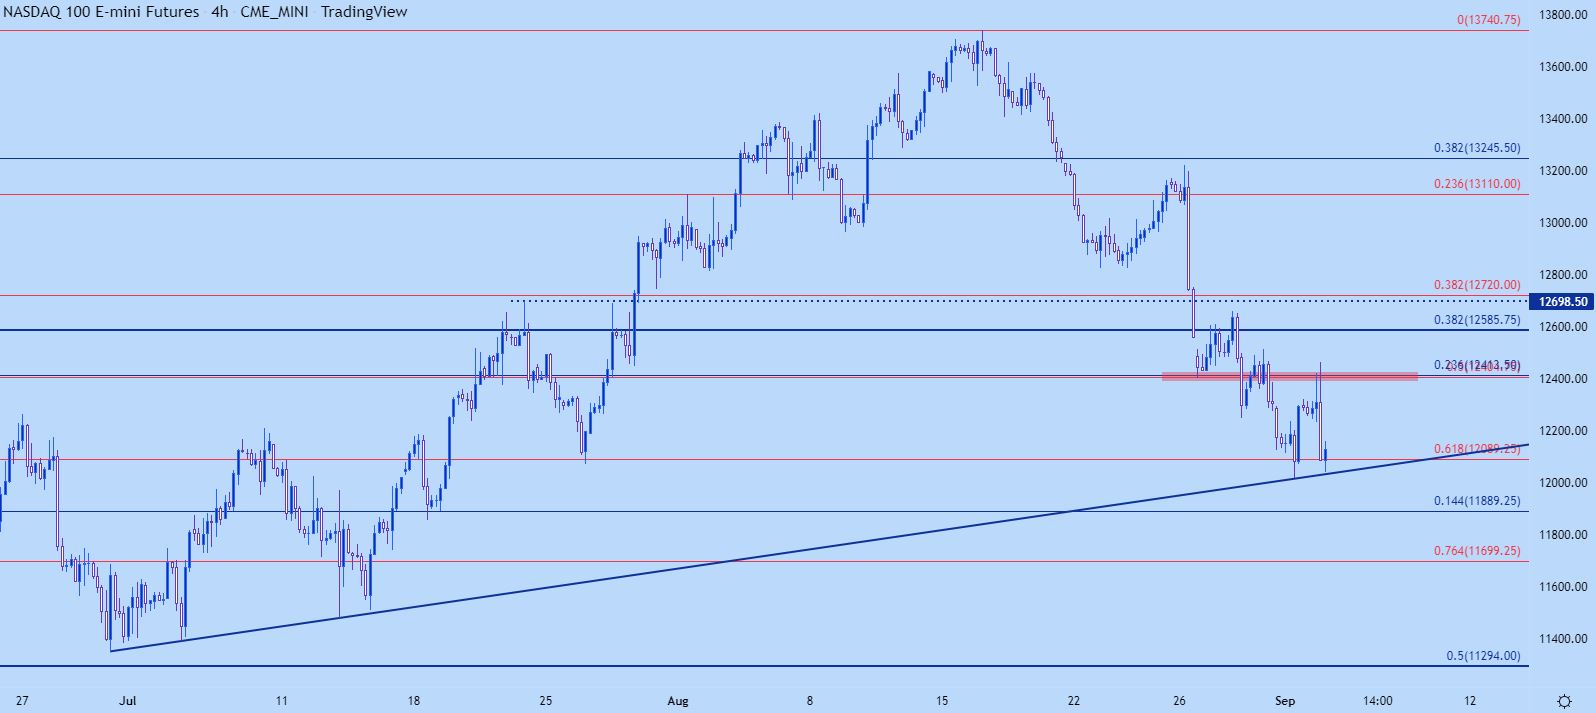
Chart prepared by James Stanley; Nasdaq 100 on Tradingview
Taking a step back on the Nasdaq, and it’s clear from the weekly chart that the tonality has changed from the two-month bullish bounce. The weekly candles resemble what was printing in April and May, and there’s no clear sign yet that this is about to shift. And if we add-in what I discussed at the beginning of this article, it would seem that there’s greater potential for a deeper bearish push.
The 11,300 level remains highly relevant for this approach. This is the 50% retracement of the 2019-2021 major move and this is the level that helped to hold the lows in June, when a vicious sell-off started to find support before, eventually, running into a two-month-rally.
A subsequent test or series of tests at this level may not be treated as well, and a fall below that price can open the door for a deeper bearish move. Notably, the 61.8% Fibonacci retracement of that major move is confluent with the 10k psychological level.
Nasdaq Weekly Price Chart

Chart prepared by James Stanley; Nasdaq 100 on Tradingview
Dow Jones
The Dow completed an evening star formation last week and it was a textbook formation, showing up right at a key area of confluent resistance. The weekly candle in mid-August finished as a doji and the week after, helped along by Chair Powell at Jackson Hole, erased the entirety of the prior two weeks’ gains. Evening stars are often followed with aim of bearish reversals, and that action continued this week as price slid down to the 23.6% retracement of this year’s sell-off.
A major area of contention for the Dow sits a little-lower on the chart, in the same space that held support in June. This is just below the 30k psychological level and it’s around the 38.2% retracement of the pandemic move.
Dow Weekly Price Chart
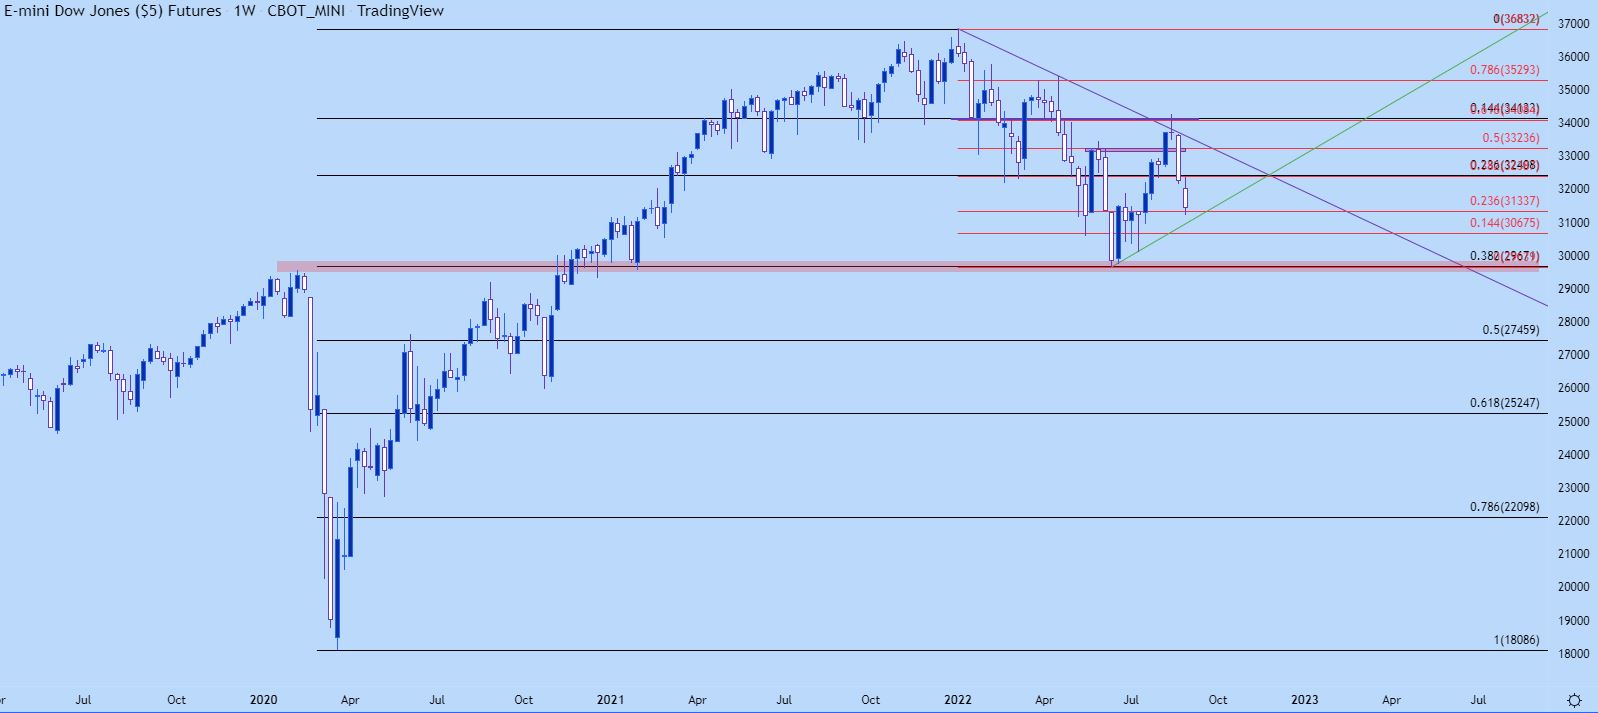
Chart prepared by James Stanley; Dow Jones on Tradingview
--- Written by James Stanley, Senior Strategist, DailyFX.com & Head of DailyFX Education
Contact and follow James on Twitter: @JStanleyFX


