


Reviewed by Nick Cawley on December 8, 2021

What is a 200-Day Moving Average
The 200-day moving average is a technical indicator used to analyze and identify long-term trends. Essentially, it is a line that represents the average closing price for the last 200 days and can be applied to any security.
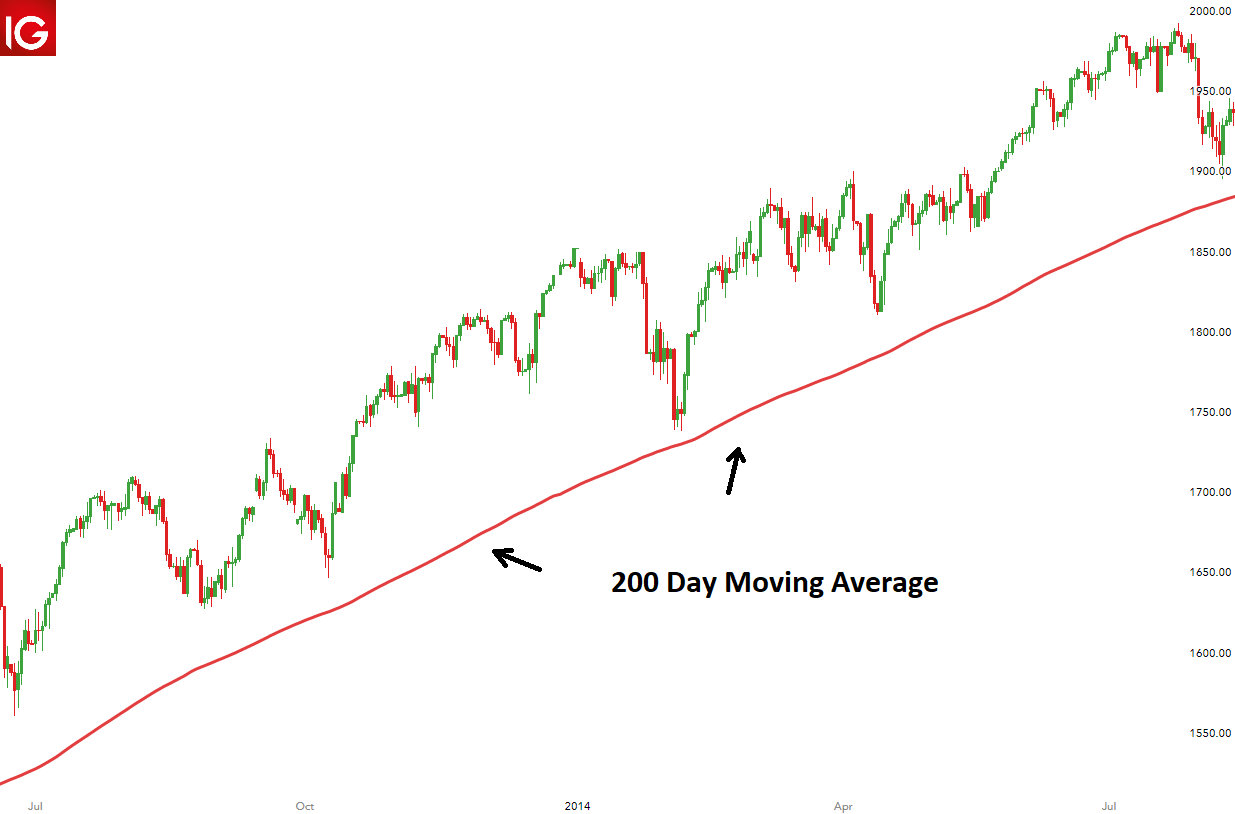
The 200-day moving average is widely used by forex traders because it is seen as a good indicator of the long-term trend in the forex market. If the price is consistently trading above the 200-day moving average, this can be viewed as an upward-trending market. Markets consistently trading below the 200-day moving average are seen to be in a downtrend.
How Do You Calculate the 200 Day Moving Average?
The 200-day moving average can be calculated by adding up the closing prices for each of the last 200 days and then dividing by 200.
200 Day Moving Average Formula = [(Day 1 + Day 2 …. + Day 200)/200]
Each new day creates a new data point. Connecting all the data points for each day will result in a continuous line which can be observed on the charts.
How Do You Use the 200 Moving Average in Your Trading Strategy?
The 200-day moving average has gained in popularity as it can be used in many different ways to assist traders.
Using the 200-Day MA as Support and Resistance
The 200-day moving average can be used to identify key levels in the FX market that have been respected before. Often in the forex market, price will approach and bounce off the 200-day moving average and continue in the direction of the existing trend. Therefore, the 200-day moving average can be viewed as dynamic support or resistance.
Below is an example of how the price approached and bounced off the 200-day moving average on the EUR/USD chart:
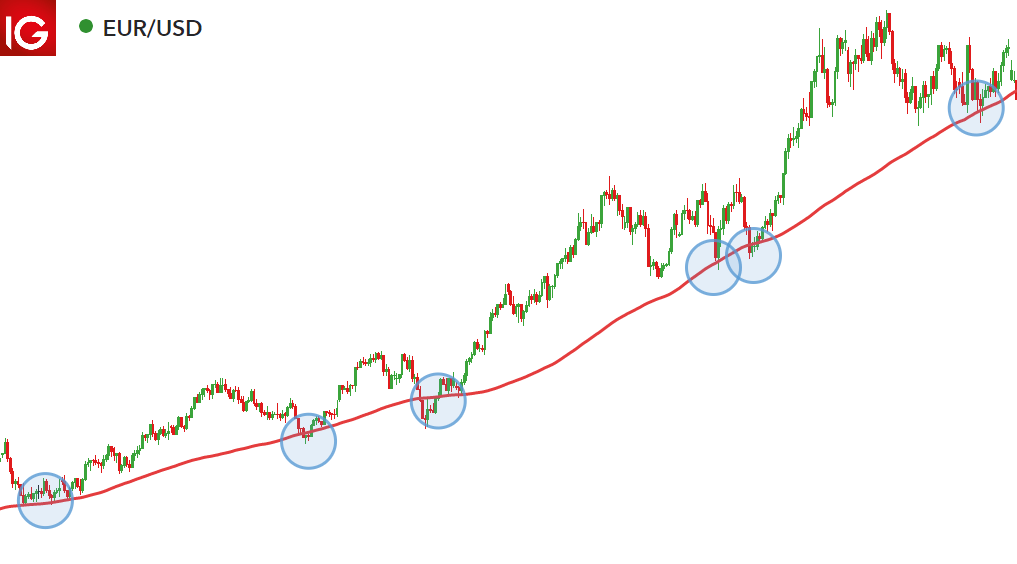
Traders will look to go long as price bounces off the 200-day moving average when the market is in an upward trend. Likewise, traders will look for short entries after the price bounces from the 200-day moving average in a down-trending market. Stops can be placed below (above) the 200 moving average in an uptrend (downtrend).
MA Crossovers
Once the long-term trend is identified, traders often assess the strength of the trend. This is important because a weakening trend could signal a trend reversal and present the ideal time to exit an existing trade.
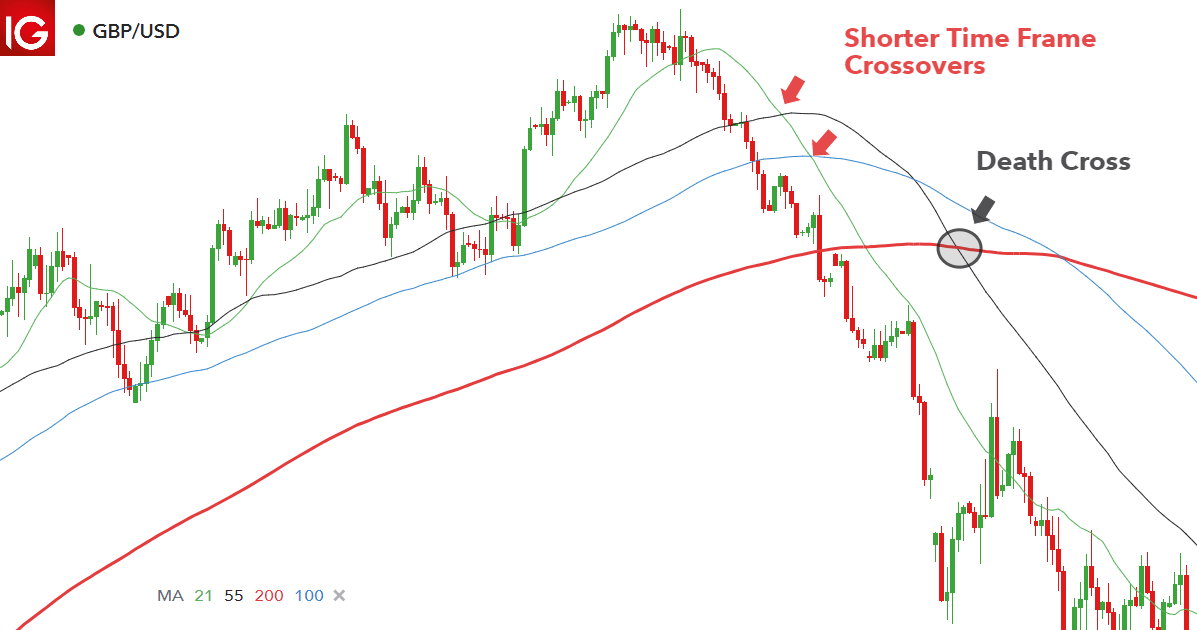
Incorporating shorter-term moving averages like the 21-, 55- and 100-day moving averages, allows traders to determine whether the existing trend is running out of steam because they track more recent price movements over a shorter time period.
The GBP/USD chart below, shows how the smaller, faster-moving averages signal that the uptrend may be about to reverse. The 21-day (green) moving average crosses through the 55-day (black) moving average and continues to cross the 100 (blue) and 200 (red) day moving averages to the downside. These are all bearish signals that appear before the 200-day moving average presents a bearish signal.

Using the 200-Day Moving Average as a Trend filter
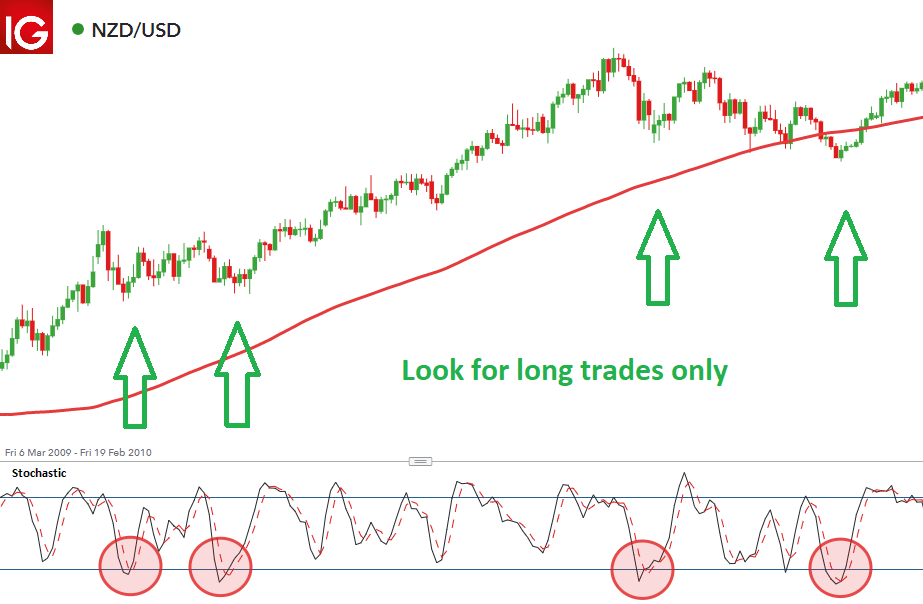
One of the easiest strategies to incorporate with the 200-day moving average is to view the market in relation to the 200-day moving average line. Traders commonly do this to analyze the general market trend and then look to only place trades in the direction of the long-term trend.
In the NZD/USD chart below, the market is trading above the 200-day moving average for a prolonged period of time. This means that the market is trending upwards and therefore, traders should only be looking for long entries into the market. The example below makes use of the stochastic oscillator however, traders should make use of an indicator or any other entry criteria they feel comfortable with.
200-Day Moving Average Indicator: A Summary
- The 200-day moving average is a widely adopted indicator showing the direction of the long-term trend in any market.
- Due to its mass adoption, the 200-day moving average can often be considered a self-fulfilling prophecy.
- Traders use the 200-day moving average to filter trades in the direction of the long-term trend and look for bounces off the 200-day moving average to inform trades.
Become a Better Trader with Our Trading Tips
- The 200-day moving average is just one of many helpful indicators. Expand your trading knowledge by reading our article on some of the most popular technical indicators
- If you are just starting out on your trading journey it is essential to understand the basics of forex trading in our free new to forex trading guide.
- Moving averages are trend-following indicators. Other trend indicators include the Ichimoku Cloud, Average Direction Index. Alternatively, trends can be identified with the use of trendlines.