


Using the Average Directional Index (ADX) in a Trading Strategy
In our last article, we looked at the ADX indicator. While many other technical indicators that try to do much more are far more popular, the Average Directional Index has but one job – to denote trend strength.
This narrow focus can be helpful to traders, as there’s little additional noise generated by the indicator: It’s a pure sign of trend strength. As we closed in our last article, traders will often use the indicator with a cut-off value, or a reading that says to them that the trend is strong enough to employ trend strategies. And if the trend isn’t strong enough, then the trader can address the market with either range or breakout strategies, essentially looking to adapt their strategy or manner of execution to the market environment.

ADX: The Cut-Off Value
In our last article, we looked at using a cut-off value of 30 for the ADX indicator. So, when the indicator reads above 30, we could say that a trend was at-play and, when below 30, there was little trend at work. This is the simplest form of integrating ADX into a trading approach, but it does miss some key inflection points; namely when a trend begins and ADX starts to register that movement. At that point, the indicator is gaining in value already as the trend is picking up strength. And then after the indicator has topped and as it begins to recede back-below the 30-level; it’s fairly clear at that point that the trend has been well-priced and that can lead to the market digesting that recent move.
But, if simplicity is the goal, using a standard cut-off point on the indicator can be helpful. As for values, 30 is common as is the value of 35. Traders looking to be much more aggressive with trends can even extend that value down to the level of 25.
EUR/USD Weekly Price Chart
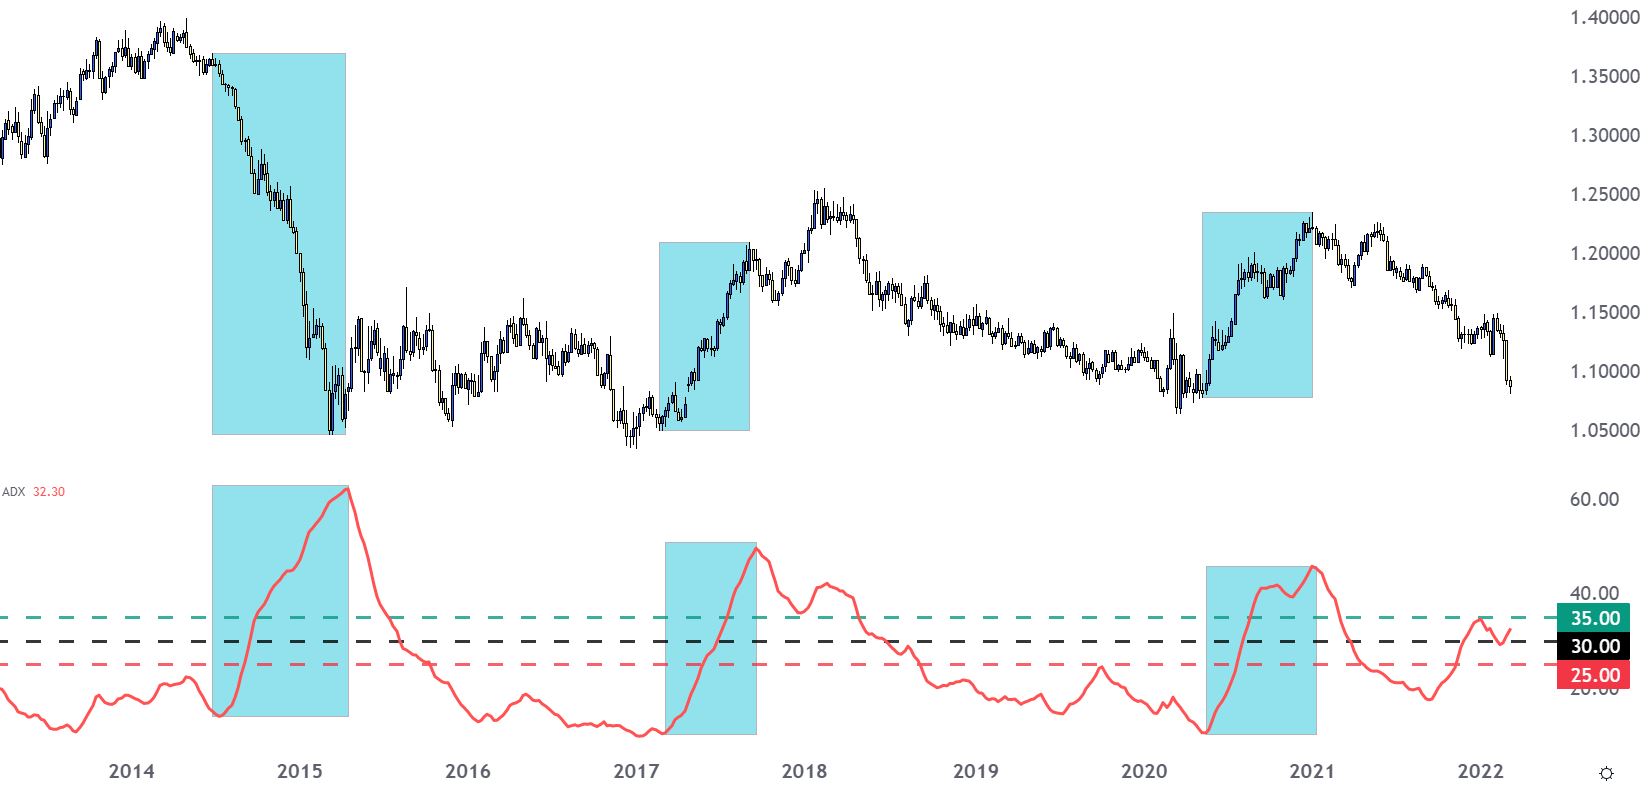
Chart prepared by James Stanley EUR/USD, Weekly chart, 2014-2022
ADX: The Moving Average
There’s another option for defining strong or weak values in ADX in the effort of grading trends, and that incorporates a moving average.
Introduction to Technical Analysis
Moving Averages
Recommended by James Stanley
Since ADX is really just a data series, a moving average can be built on the indicator itself to illustrate growing or waning trend strength. Traders can then get an earlier look at fresh trends as they begin along with an early look when they might be ending. The downside is that it may indicate an oncoming trend that never actually shows up, as you can see in below graphic many ADX/moving average crossovers take place well-below the 30 value on the indicator.
On the below chart, I’ve added a 14 period simple moving average in blue, plotted on top of ADX in red.
EUR/USD Weekly Price Chart
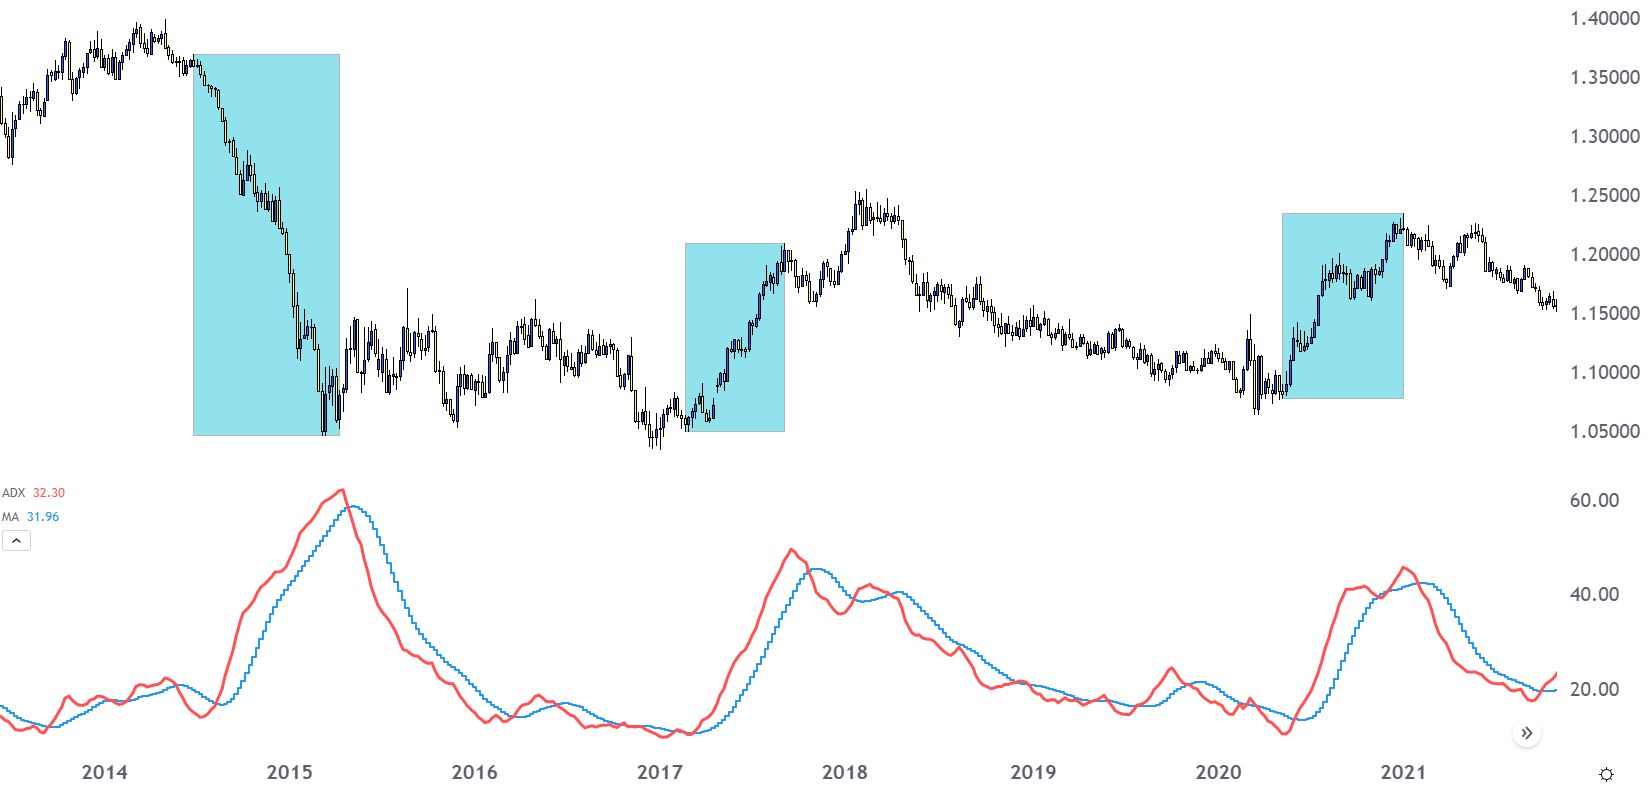
Chart prepared by James Stanley EUR/USD, Weekly chart, 2014-2022

--- Written by James Stanley, Senior Strategist for DailyFX.com
Contact and follow James on Twitter: @JStanleyFX