


Indices Talking Points:
- US Stocks have taken on a tone of weakness following Chair Powell’s speech at Jackson Hole last Friday.
- While equity rallies had built from the June lows, driven by the apparent assumption that the Fed may be nearing a policy pivot, Powell’s remarks made clear that the bank’s priority is on tackling inflation.
- This will likely usher in a renewed focus on data as market participants look for greater signs of economic slowing via jobs and inflation, which highlights tomorrow’s release of Non-farm Payroll numbers for the month of August.
- The analysis contained in article relies on price action and chart formations. To learn more about price action or chart patterns, check out our DailyFX Education section.

Stocks were rocked after Jerome Powell’s speech at Jackson Hole. While the tug-of-war was apparent before last Friday, with some market participants anticipating a policy pivot from the Fed while others were looking for continued hawkish drive to address inflation, the head of the US Central Bank made clear that the focus and priority was on addressing inflation. I discussed this premise in the equity forecast a couple weeks ago, highlighting the fact that it seems that the Fed can’t really afford to miss the mark here.
Inflation can create massive problems and historically speaking, we’re already at far-elevated levels. The most recent example of inflation in this range was in the late-70’s, the era of stagflation. The Fed continued to hike but inflation only continued to rise, and at the source of the problem was an unwillingness of the FOMC Chair at the time, Arthur Burns, to risk a hit to growth by hiking too much. So the problem only continued to build. Until Paul Volcker, that is, who had the idea that to tame inflation, the Fed would have to drain the excess reserves from the banking system, and the best way to do that was by incentivizing that capital with higher rates (and thereby producing an opportunity cost to that capital).
But – to do that Volcker had to hike rates even above inflation. In 1980, CPI was at 13.5%. But Fed Funds was at a whopping 20%! Within two years, inflation had come down and by 1983 CPI was back-below 3%.
The problem is that the US debt-to-GDP ratio is at 137.5% and when Volcker made his move, it was sub-40%. So the US carries much more debt today than it did then, and debt service on such a massive amount of debt makes Volcker’s gambit seem less possible today than it did then.
So, the Fed really wants to get inflation down here because the consequences could be sizable and not simple to address. And this can continue to act as a pressure point for stocks as the Fed is still uncertain of how high they’ll need to hike to actually get inflation to more tolerable levels.
With NFP for tomorrow – tensions are high. This means that moves could be exacerbated on either side based on how the data comes out. And while this might be a captain obvious statement around most NFPs, the deck seems to be especially loaded here as market sentiment remains in a generally terrible state, and this is something where the slightest hint of positivity could create a short-covering rally. The question at that point is how aggressive bears will remain to be – and whether they’ll use those rallies to try to leg into longer-term bearish positions. As such, my resistance levels below are a little wider than usual, in the event of a short-squeeze fueled pullback in US equity indices around NFP tomorrow.
S&P 500
In the S&P 500, prices are down almost 10% from the high set in the middle of August, right when price action ran into the 200 day moving average. There is still room to go before testing the prior June lows, however, and a point of support along the way is at 3915, which is the 23.6% Fibonacci retracement of the 2022 sell-off move. This was also a spot of resistance-turned-support in June/July, and a breach below this level opens the door for further downside breakout potential.
S&P 500 Daily Price Chart

Chart prepared by James Stanley; S&P 500 on Tradingview
S&P Levels Shorter-Term
Below 3915 is a trendline projection taken from June and July swing lows, and this currently projects to around 3883. Below that is a prior price action swing low at 3820, after which the July low comes into play at 3723. On the resistance side of the coin, 3964 was the Tuesday low and that remains a possible point of resistance. If bulls can take that out, 4k/4016 comes back into the picture.
S&P 500 Two-Hour Chart
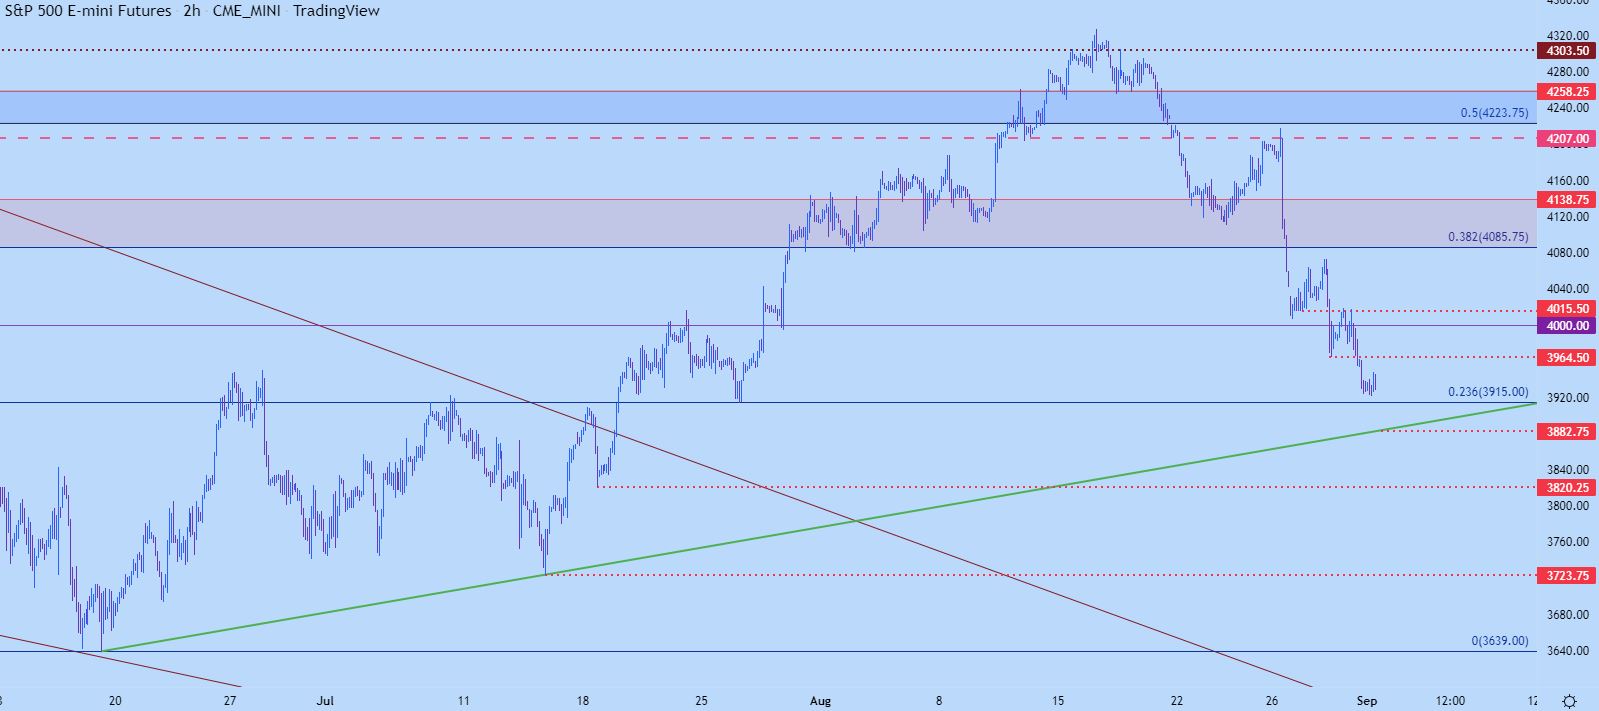
Chart prepared by James Stanley; S&P 500 on Tradingview
Nasdaq 100
The fall has been steep in the Nasdaq so far and overnight price traded through yet another trendline. That now becomes resistance potential and it projects to a familiar level around 12,262. If price can budge above that, there’s another spot of resistance potential around 12,474, after which this week’s high comes into play at 12,652.
On the support side of the matter, I’m tracking a price action support level around 12,074, although that was single touch so it could be messy down to around 12k. Below that, 11,860 is in focus after which a longer-term Fibonacci level plotted at 11,698 comes into the picture.
Nasdaq 100 Four-Hour Price Chart
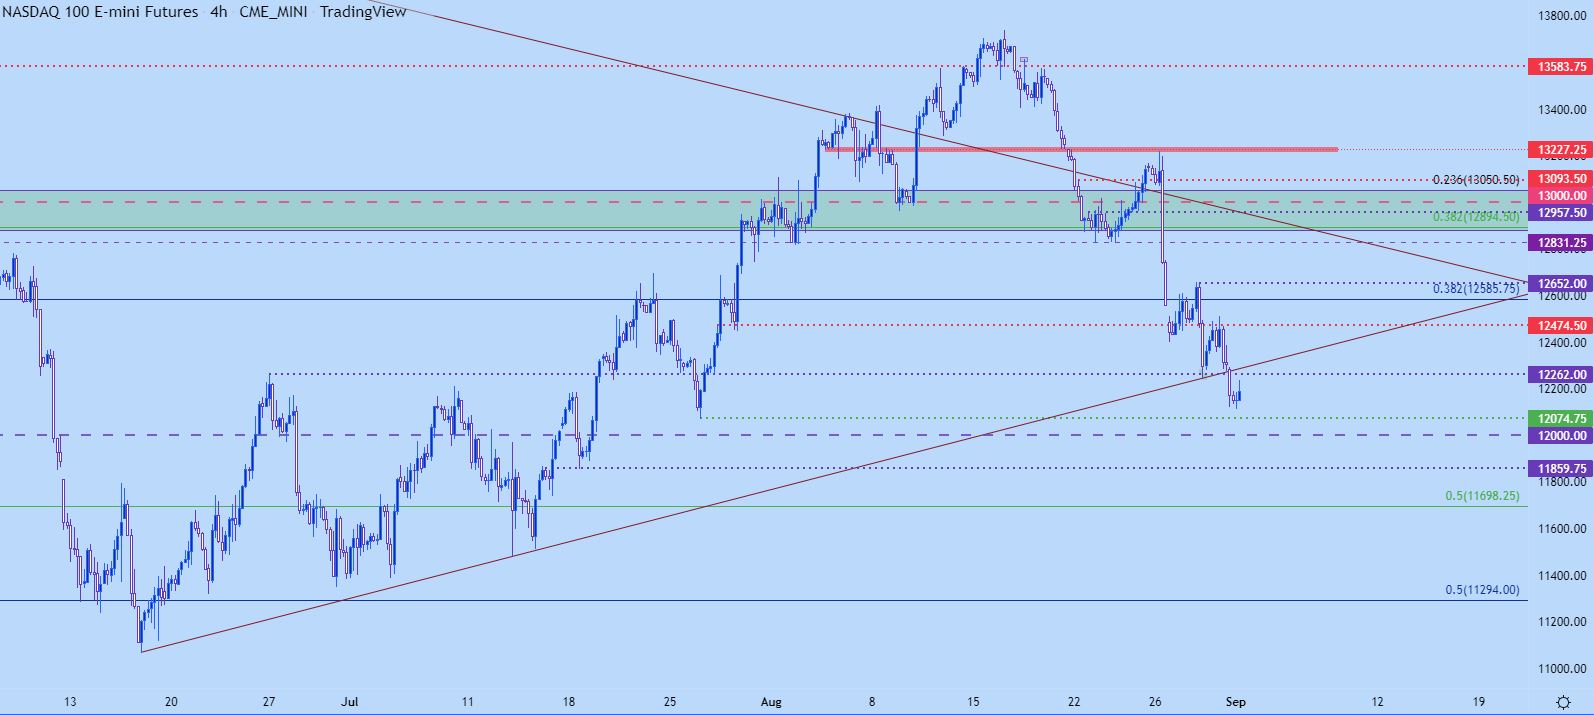
Chart prepared by James Stanley; Nasdaq 100 on Tradingview
The Dow is at Major Support
The recovery in the Dow took on the form of a rising wedge formation and that had started to break even before Chair Powell’s speech.
But, the day of Jackson Hole produced a bearish engulfing candlestick and that’s only continued since. At this point, the Dow is testing a confluent spot of Fibonacci support around 31,337. This is around the 61.8% retracement of the recovery move which is also around the 23.6% retracement of the 2022 sell-off. A break-below that zone opens the door for a move down to the 78.6% Fibonacci retracement of the bounce move, which plots at 30,726, after which the 30k psychological level comes into the picture. On the resistance side of the coin, the 50% mark of that bounce move remains relevant and it tried to hold support on Monday before showing as resistance yesterday. Above that, another confluent zone exists around the 32,400 area.
Dow Jones Daily Price Chart
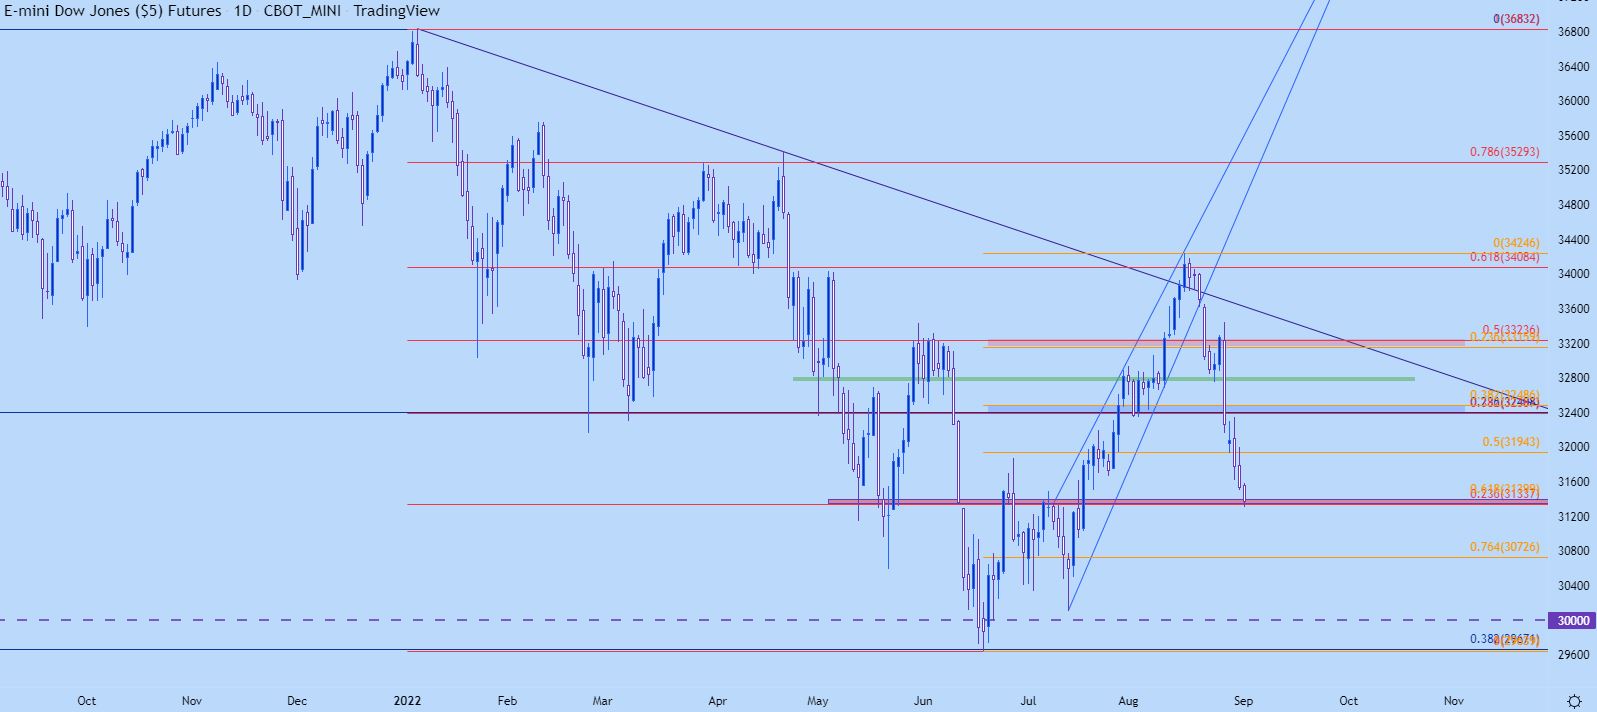
Chart prepared by James Stanley; Dow Jones on Tradingview
--- Written by James Stanley, Senior Strategist, DailyFX.com & Head of DailyFX Education
Contact and follow James on Twitter: @JStanleyFX


