


Crude Oil Technical Forecast: WTI Weekly Trade Levels
- Crude Oil updated technical trade levels – Weekly Chart
- WTI marks second weekly reversal off critical support pivot at 65.72-66.57
- New to Oil Trading? Get started with this Free How to Trade Oil-Beginners Guide
Oil prices ended the week higher despite an early-week plunge of more than 4.1% with WTI poised to close at 68.50 on Friday in New York (+0.7%). The rebound marks the defense of a critical pivot zone we’ve been tracking for months and it’s make or break for the crude bulls. These are the updated targets and invalidation levels that matter on the oil price weekly chart. Review my latest Strategy Webinar for an in-depth breakdown of this crude oil price technical setup and more.
Crude Oil Price Chart – WTI Weekly
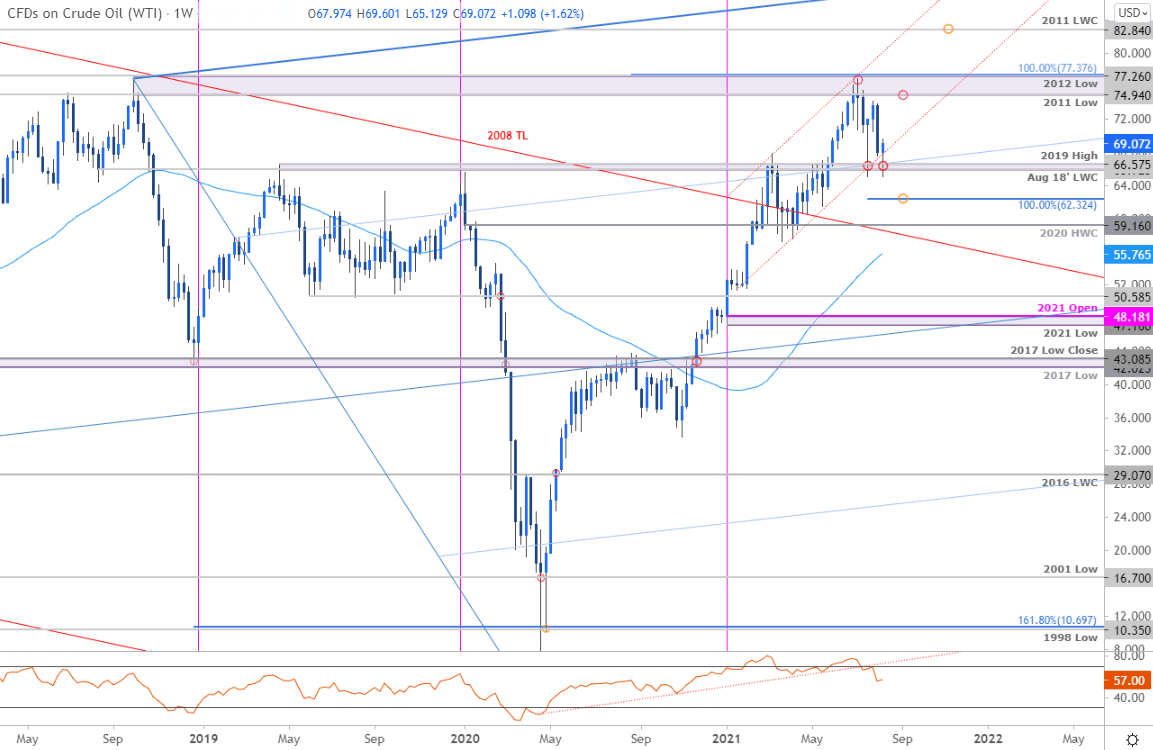
Chart Prepared by Michael Boutros, Technical Strategist; Crude Oil (WTI) on Tradingview
Notes:In last month’s Crude Oil Price Forecast we noted that the, “price sell-off is now eyeing major confluent uptrend support at 65.92-66.57 – we’re on the lookout for possible inflection down here.” WTI rallied more than 14% off that lows in the following weeks before plummeting back down into this critical support pivot yet again this week. Oil is poised to close higher on the week after defending this key threshold- is a low in place?
The immediate focus is on a breakout of a massive monthly range just above key support. Initial weekly resistance stands at the 61.8% Fibonacci retracement of the July sell-off at 72.43 backed by the 2011 & 2012 lows / 2021 yearly high / 100% extension at 74.94-77.37 – a breach / close above this threshold is ultimately needed to mark resumption of the broader uptrend with such a scenario exposing the 2011 low-week close at 82.84. A break below this key support zone would likely risk another bout of accelerated losses for crude with subsequent support objectives eyed at the 100% extension of the July decline at 62.32 and the 2020 high week reversal close at 59.16.

Bottom line: The oil price sell-off has once again responded to a key technical pivot zone and the battle lines are drawn of the bears. From at trading standpoint, a good zone to reduce short-exposure / lower protective stops – look for exhaustion ahead of 72.43 IF price is heading lower with a close below 65.92 needed to threaten a larger correction. Don’t underestimate this support zone – stay nimble. I’ll publish an updated Crude Oil Price Outlook once we get further clarity on the near-term WTI technical trade levels.
For a complete breakdown of Michael’s trading strategy, review his Foundations of Technical Analysis series on Building a Trading Strategy
Crude Oil Trader Sentiment – WTI Price Chart
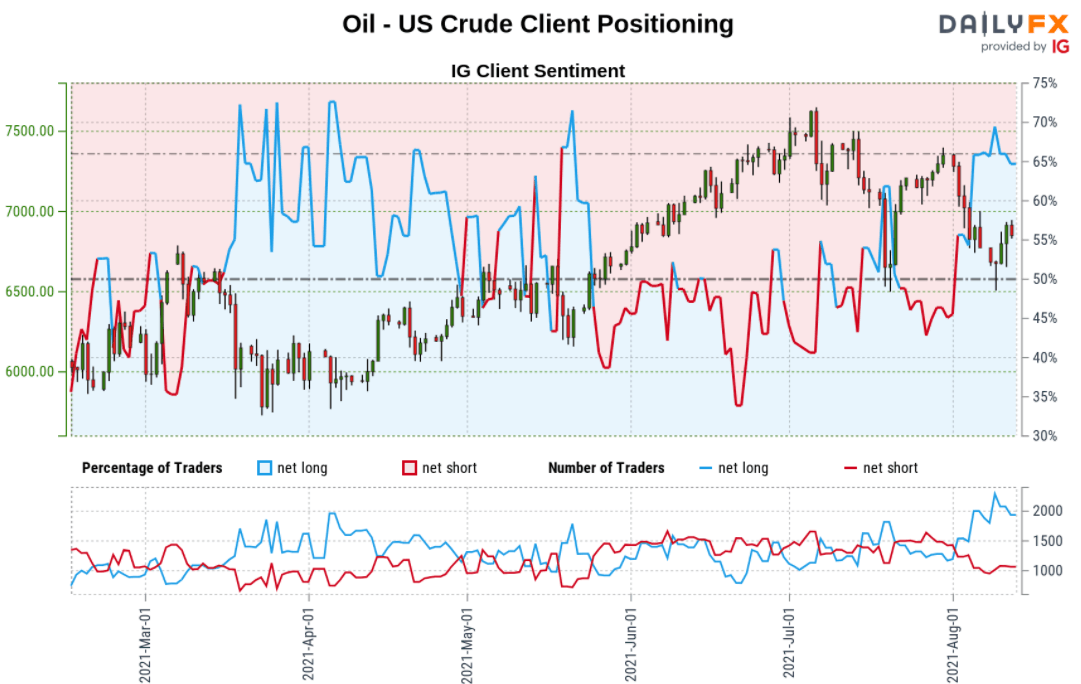
- A summary of IG Client Sentiment shows traders are net-long crude oil - the ratio stands at +1.89 (65.43% of traders are long) – typically bearish reading
- Long positions are 2.65% higher than yesterday and 3.45% lower from last week
- Short positions are1.39% lower than yesterday and 2.11% higher from last week
- We typically take a contrarian view to crowd sentiment, and the fact traders are net-long suggests Oil - US Crude prices may continue to fall. Traders are more net-long than yesterday but less net-long from last week. The combination of current positioning and recent changes gives us a further mixed Oil - US Crude trading bias from a sentiment standpoint.
| Change in | Longs | Shorts | OI |
| Daily | 3% | -7% | 1% |
| Weekly | 31% | -38% | 7% |
---
Previous Weekly Technical Charts
- Canadian Dollar (USD/CAD)
- Euro (EUR/USD)
- Gold (XAU/USD)
- US Dollar Index (DXY)
- Australian Dollar (AUD/USD)
- New Zealand Dollar (NZD/USD)
- Sterling (GBP/USD)

--- Written by Michael Boutros, Technical Strategist with DailyFX
Follow Michael on Twitter @MBForex


