


Technical Forecast for the US Dollar: Bullish
- The US Dollar reversal got a shot-in-the-arm this week as USD price action burst up to a fresh monthly high.
- The degree of impact from this USD move has carried varying force, depending on the pair being followed – and that observation may help with strategy parameters for the week ahead.
- The analysis contained in article relies on price action and chart formations,. While also focusing on a bullish engulfing candlestick on the Monthly US Dollar chart. To learn more about price action or chart patterns, check out our DailyFX Education section.
US Dollar Reversal Beings to Set In
Things change pretty fast in global markets and nowhere is that more evident than the US Dollar. Well, it’s been pretty evident in stocks, too, but I digress; and frankly these themes may have some element of linkage as the September open marked an inflection point and neither stocks nor the Dollar have been the same ever since.
In the USD, there’s a couple of key drivers in the Dollar’s run. The first of which and most pertinent to this article given the technical focus – is a huge zone of confluent support that helped to arrest the five-month-downtrend earlier this month. But, also at issue and highlighted by the recent rise of pressure in US equities, is a bit of risk aversion as coronavirus numbers have grown and, at least at this point, Congress has been unable to pass another stimulus package.
In the latter-portion of August I asked whether we’d seen capitulation from USD bears. That appears to have been a little early as the Dollar tip-toed down to support in the final week of last month; but that’s when a big zone of long-term, confluent support came into the equation that’s helped to quell the declines. This key support zone is also the ‘s3’ level that was shared in the Q3 technical forecast, in which we looked for a continued sell-off in USD. But now that it’s come to fruition – the big question is ‘what’s next?’

It must be considered with at least some curiosity the fact that the USD has largely gained since the Jackson Hole announcement from Chair Powell. With the Fed getting even more flexibility with when or how they raise rates, one might imagine that the net effect would be one of USD-weakness. And in the immediate aftermath of that announcement – it was. But just a few days later the USD ran into this big spot of support on the chart and, since then, matters haven’t been the same.
At this point, the monthly chart of DXY is showing a not-yet-completed bullish engulfing pattern, which came into play after support was tested on September 1st. This has allowed the USD to retrace 50% of the sell-off that posted through July and August.
US Dollar Monthly Price Chart

Chart prepared by James Stanley; USD, DXY on Tradingview
Taking a shorter-term look at the matter and it was this week where the USD jump really began to build-in. Shortly after this week’s open, the currency was testing a big area of support – the same that had been in-play for the prior week-and-a-half including through the FOMC rate decision. But Monday saw buyers come into the market with gusto and prices quickly lifted, soon setting a fresh monthly high and then continuing to trend even-higher.
Along the way, a bit of resistance developed around 94.23, which is the 38.2% retracement of the 2017-2018 major move; but prices broke-out on Wednesday, pushed-higher on Thursday and checked back for support at this same level on Friday morning.
US Dollar Four-Hour Price Chart
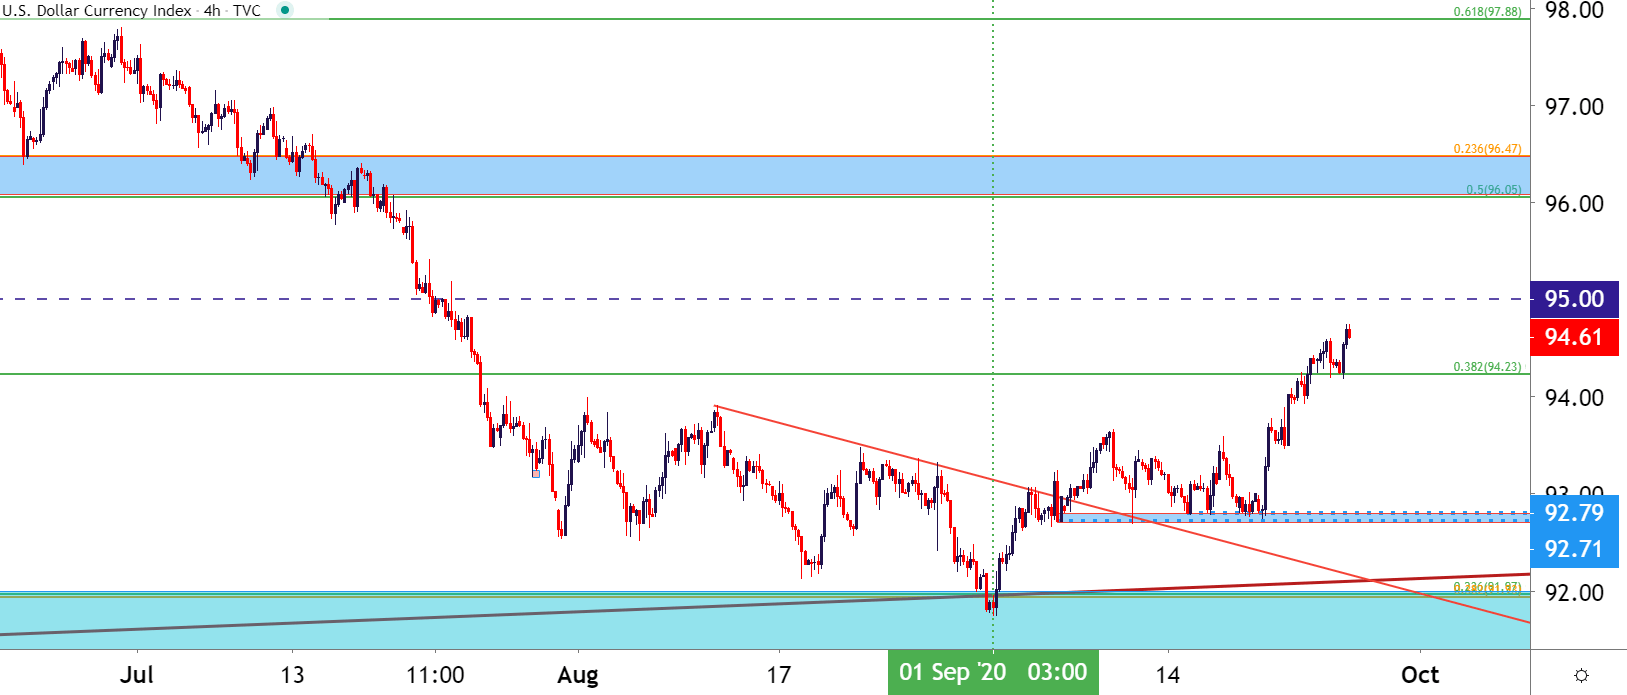
Chart prepared by James Stanley; USD, DXY on Tradingview
EUR/USD Sets Two-Month-Lows After 1.2000 Rebuke
A natural counter-side to the US Dollar, the Euro has seen a trend reversal in September after a really strong showing this summer, particularly against the USD. EUR/USD jumped from lows below 1.0800 in mid-May all the way up to the 1.2000 handle in early-September. But, as I had warned in early-August, that test would likely be an item of interest in the pair; and it has been.
EUR/USD put up its first test above 1.2000 on September 1st. This was a two-year-high as the pair continued what could be described as a strong rally; but that’s also where the proverbial music stopped and sellers showed up along the way.
What’s peculiar here and this somewhat links to the USD item around the Fed: Given recent events at the ECB one might’ve expected the exact opposite of what’s happening to take place. The ECB appeared unphased by a strong Euro, and this indicates that the bank wasn’t looking to weaken the currency which, generally, would be construed as a positive item for the Euro. Just as we’ve seen in the US around the Dollar following Powell’s Jackson Hole comments – that theme hasn’t come to fruition and by most accounts, the exact opposite has happened. So further weakness may be ahead in the pair as something else appears to be going on. The forecast for EUR/USD will be set to bearish for the week ahead.
| Change in | Longs | Shorts | OI |
| Daily | -1% | -4% | -3% |
| Weekly | 4% | -10% | -5% |
Regarding setup potential – I had discussed this in my recently posted analyst pick, looking for a pullback to resistance around prior near-term support, taken from around the 1.1750 psychological area.
EUR/USD Technical Forecast: Bearish
EUR/USD Daily Price Chart

Chart prepared by James Stanley; EUR/USD on Tradingview
AUD/USD Reversal Plays Through - .7000 Big Figure Ahead
Last week’s Australian Dollar Technical Forecast was titled: AUD/USD May be Setting the Stage for Reversal.
That’s pretty much played out throughout the week as AUD/USD fell from the Rising Wedge formation, all the way down to fresh two-month-lows. At issue is support: AUD/USD is re-testing the .7000 big figure and this can be a difficult spot to scope for continuation. As a matter of fact, this may be priming the pair for reversal plays next week, particularly if the US Dollar does pull back. And while this isn’t enough to behoove a bullish technical forecast for the pair, it is something to keep on the radar, particularly for those who are looking to fade this recent run in USD. The forecast for AUD/USD next week will be set to neutral.
AUD/USD Technical Forecast: Neutral
AUD/USD Eight-Hour Price Chart: Back to the Big Fig

Chart prepared by James Stanley; AUD/USD on Tradingview
USD/CAD Extends Reversal
Going along with the USD reversal theme and USD/CAD has been a fairly clean variant so far. Similarly, the pair set a fresh low on September 1st, after which buying pressure began to appear; and recent price action in both DXY and USD/CAD have mirrored each other fairly well. The below chart overlays both assets with DXY represented by the blue line as USD/CAD is represented by candlesticks.
USD/CAD Four-Hour Price Chart

Chart prepared by James Stanley; USD/CAD on Tradingview
| Change in | Longs | Shorts | OI |
| Daily | -2% | 7% | 5% |
| Weekly | -30% | 38% | 13% |
The item of apprehension in USD/CAD is similar to that in the USD, which is the fact that the market has already put in a very respectable move in a fairly short period of time. There may be some pullback potential into early-next week, and this can keep the door open to supports at 1.3320-1.3357 (aggressive) or 1.3235-1.3250. If neither of those hold, there’s another area of interest that caught numerous inflections heading into this week, plotted around the 1.3130-1.3150 area on the chart. The forecast for USD/CAD will be set to bullish for the week ahead.
Technical Forecast for USD/CAD: Bullish
USD/CAD Two-Hour Price Chart
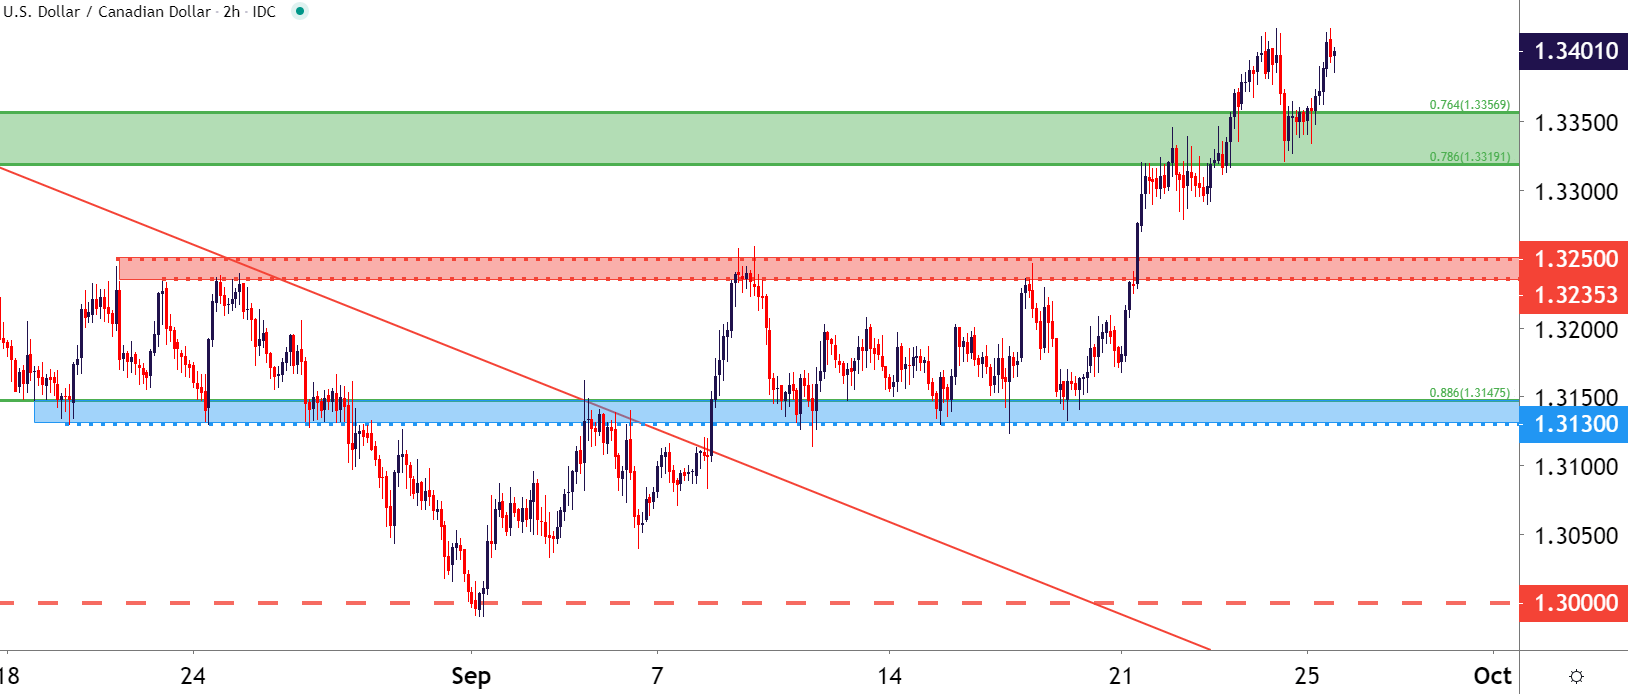
Chart prepared by James Stanley; USD/CAD on Tradingview
GBP/USD: Cable Collapses but Finally Finds Support
I’ve saved the most aggressive one for last…
GBP/USD has been in a hard bearish trend so far in September and the pair has fallen by more than any of the above pairs. GBP/USD has given back as much as 5.98% so far this month but perhaps the most glaring aspect of the move is how the pair went from a strong bullish trend coming into the month to an aggressive bearish trend shortly after the monthly open.
But – as highlighted in this week’s Analyst Pick, there may be some hope on the horizon for GBP/USD bulls as the pair has finally found some support that’s been able to cauterize the lows. This support shows at 1.2712, and is the 61.8% Fibonacci retracement of the December to March major move. That price came into play on Tuesday and despite a persistent draw from sellers, it’s helped to hold the lows for the final four trading days of this week.
| Change in | Longs | Shorts | OI |
| Daily | 3% | -7% | -3% |
| Weekly | 4% | -10% | -5% |
So this may be another item of interest for those looking to fade this recent round of USD-strength, perhaps even more so than AUD/USD looked at above as the selling pressure there hasn’t yet given signs of abatement; whereas in GBP/USD, at least that selling pressure has slowed through the latter-portion of this week, even with continued USD strength.
The technical forecast for GBP/USD will be set to bullish for the week ahead, largely on the basis of a support hold even with a strengthening US Dollar. If the Dollar does reverse or pullback from these fresh highs, there could be some bounce to work with for GBP/USD bulls.
GBP/USD Technical Forecast: Bullish
GBP/USD Eight-Hour Price Chart

Chart prepared by James Stanley; GBP/USD on Tradingview
--- Written by James Stanley, Strategist for DailyFX.com
Contact and follow James on Twitter: @JStanleyFX


