


US Dollar Price Action Talking Points:
- The US Dollar has built-in a short-term range so far in August, coming on the heels of an aggressively bearish outing in the month of July.
- US Dollar price action set a doji for last week’s trade, keeping the door open to short-term pullback/reversal themes. This may be a sought-after theme in EUR/USD.
- For short-side continuation of USD-weakness, GBP/USD may hold some allure as the pair has now thrice tested support in the 1.3000-1.3018 zone for support in August.
US Dollar Coils After a Big Outing in July
We’re not quite at the half-way point for Q3 but, already, it’s been a tough outing for the US Dollar. The currency came into the quarter holding on to a range-bound formation that’d been in-play for a few weeks already. But after pushing down to support in mid-July, buyers went on hiatus and the bottom fell out of price action as the US Dollar fell, and fell and fell. Eventually the Greenback found support around the 92.50 level on the final day of July. Since then price action has been showing more mean reversion with another test of that same support on Wednesday and Thursday of last week.
US Dollar Four-Hour Price Chart

Chart prepared by James Stanley; USD, DXY on Tradingview
Friday brought a quick pop in the USD, helped along by the Non-Farm Payrolls report. That strength has continued to show in the early-portion of this week, with USD price action making an approach towards range resistance at 93.75-94.00; with the former of those prices previously functioning as the two-year-low until it was taken out a couple of weeks ago.

On the weekly chart below, notice how last week’s Doji follows that prior support test. Should this week present a backdrop of strength, there may be a morning star formation to work with and for USD bulls this could be an item of excitement, as that formation will often be approached with the aim of reversals.
This puts even more focus on the short-term resistance looked at above. For a morning star formation to come alive this week, near-term price action will need to push through that key zone of resistance; which would keep the door open for short-term strategies of strength around the US Dollar.
US Dollar Weekly Price Chart

Chart prepared by James Stanley; USD, DXY on Tradingview
EUR/USD Finds Resistance at Long-Term Trendline
The tough thing about trendlines are the subjectivity surrounding them. Which trendline is right? While there’s multiple mechanisms purporting to offer some element of answer the reality of it is the most operable trendline is the one that works… and until that trendline or possible trendline comes into play, there’s really no way of knowing which is ‘right.’
To learn more about drawing trendlines, check out Introduction to Basic Trendline Analysis in the DailyFX Education Section.

EUR/USD Monthly Price Chart
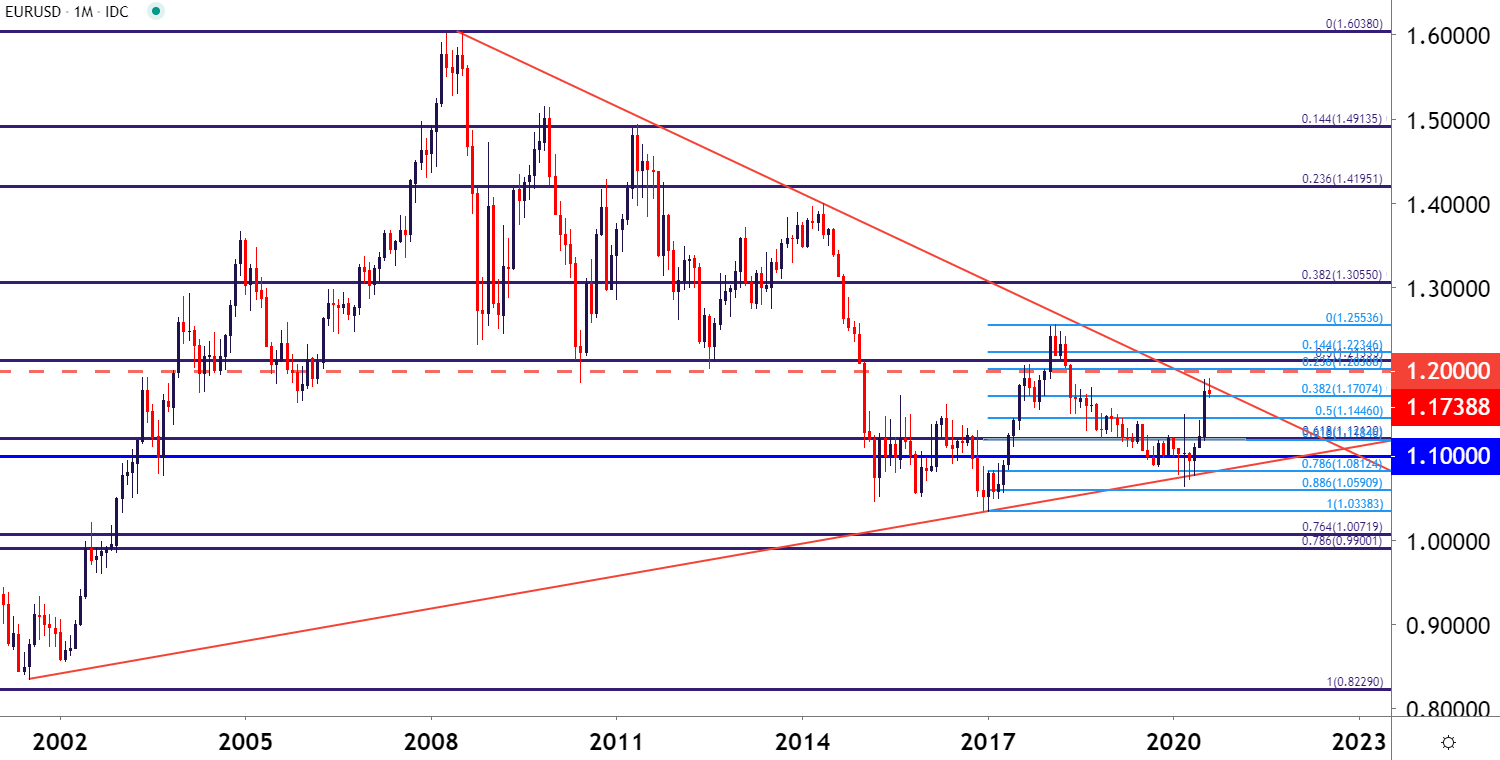
Chart prepared by James Stanley; EUR/USD on Tradingview
This is relevant on EUR/USD as there’s a trendline that I’ve seen drawn in a number of ways from a number of analysts. There’s no definitive ‘right’ here. But, if one connects the 2008-2014 swing-highs, there’s a recent item of relevance as EUR/USD price action ran into this projection two weeks ago. Last week saw another outing of resistance respecting this level; and very similar to the mirror image of the US Dollar above, there’s two of the first three steps for an evening star formation. Such formations will often be approached with the aim of bearish reversals, and given the synchronicity to the USD setup above, this could be an operative area for USD-bulls and EUR/USD bears to follow this week; looking for a hold of that resistance and for prices to push back towards the 1.1700 and 1.1600 areas.
EUR/USD Weekly Price Chart
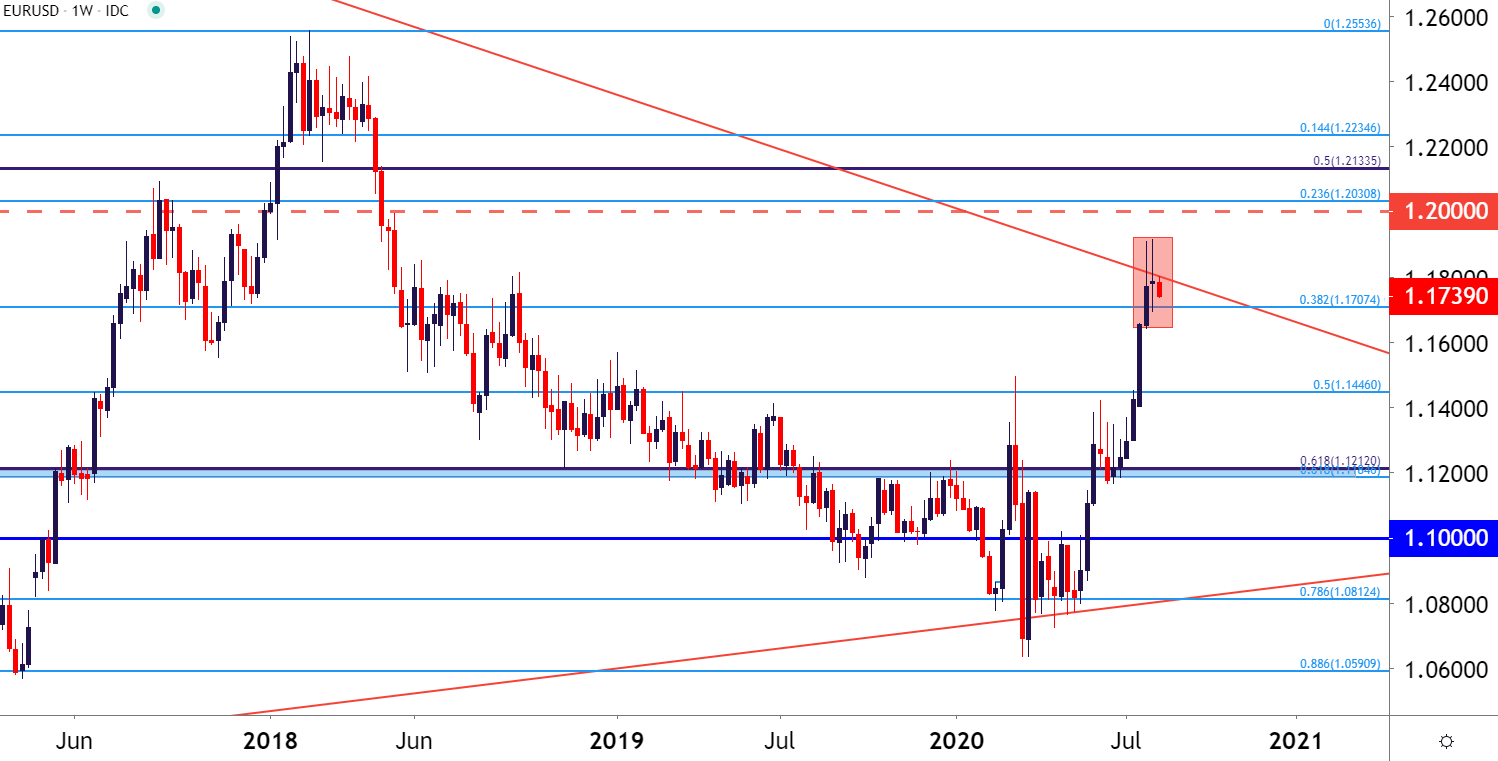
Chart prepared by James Stanley; EUR/USD on Tradingview
GBP/USD Trades in Tighter Band, Holds the 1.3000 Spot
After a really strong month of July the trend in GBP/USD has cooled and a fair amount of mean reversion has showed so far in August. One constant so far in the early month has been an adherence to support around the 1.3000 psychological level. But, at this point, GBP/USD bulls have looked very unwilling to revisit the March high, perched at the 1.3200 level, and there’s been two separate pullbacks that have developed ahead of a test of that key resistance. Given that the second failed attempt at 1.3200 did produce a higher-high, there’s still potential for bulls here, and this can keep the door open to topside themes, looking for a test of that 1.3200 swing high that hasn’t been touched in five months.
GBP/USD Daily Price Chart

Chart prepared by James Stanley; GBP/USD on Tradingview
--- Written by James Stanley, Strategist for DailyFX.com
Contact and follow James on Twitter: @JStanleyFX


