


Australian Dollar, AUD/USD, Aussie Technical Forecast: Bearish
- AUD/USD put in a second consecutive week of indecision on the chart.
- Reading between the lines, with an elongated case of RSI divergence on the Daily and a shorter-term rising wedge on the four-hour, the door may soon be opening for reversal scenarios in the pair.
- The analysis in this article heavily utilizes price action and chart patterns. To learn more about price action, check out our DailyFX Education section, where it’s taught amongst a host of other candlestick patterns and formations.
AUD/USD Two Weeks of Indecision with Possible Reversal Brewing Shorter-Term
It was a slow week in AUD/USD as price action put in a second consecutive indecision formation on the weekly chart. This comes after a fairly dramatic start to September, when the pair jumped up to a fresh two-year-high only to reverse in the days after. That pullback lasted until price action pushed down to a key support zone, and that’s since helped to hold the lows over the past two weeks, helping to produce those indecision formations on the longer-term look. This week’s candle in AUD/USD takes on more of an appearance of a spinning top following last week’s print of a doji.
AUD/USD Weekly Price Chart
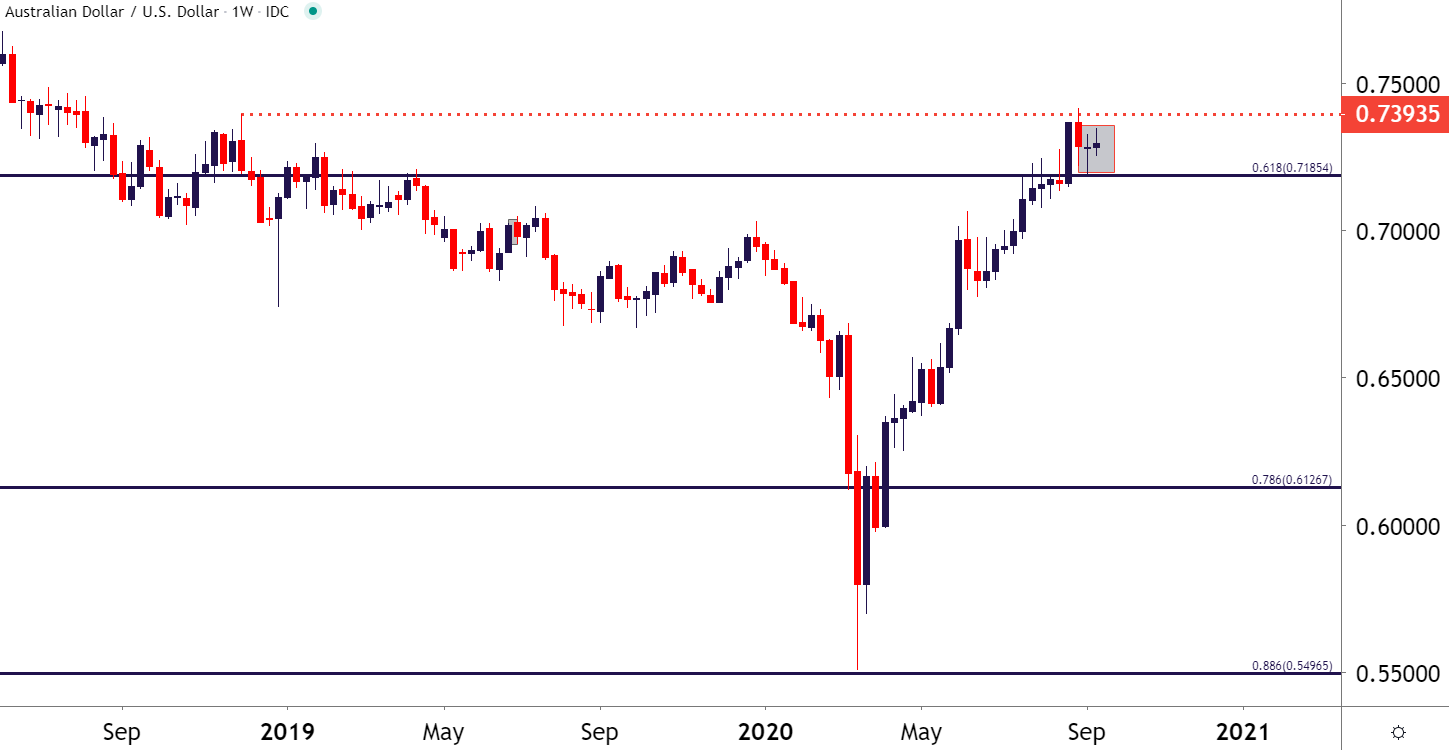
Chart prepared by James Stanley; AUD/USD on Tradingview
From the Daily AUD/USD chart, a few key levels show potential for the coming week: The price of .7394 is the prior high from August of 2018, and this is the level that appears to have stopped bulls in their tracks on September 1st. But, below that, and helping with resistance over the past week, is the price of .7325, which has brought sellers into the mid for four of the past seven trading sessions.

Also of note is the psychological level at .7250: This price produced some near-term resistance as the bullish trend was continuing to develop in August, and has more recently come into the picture as short-term support. And below that is the price of .7185, which is the 61.8% Fibonacci retracement of the 2001 low up to the 2011 high; and this is a level that’s been in-play for some time now.
Also of relevance on the Daily chart is a continued case of divergence as shown by RSI. Even as prices in the pair have continued to jump-higher through much of the summer, RSI has had a tendency to show lower-highs, as indicated in the chart below.
AUD/USD Daily Price Chart
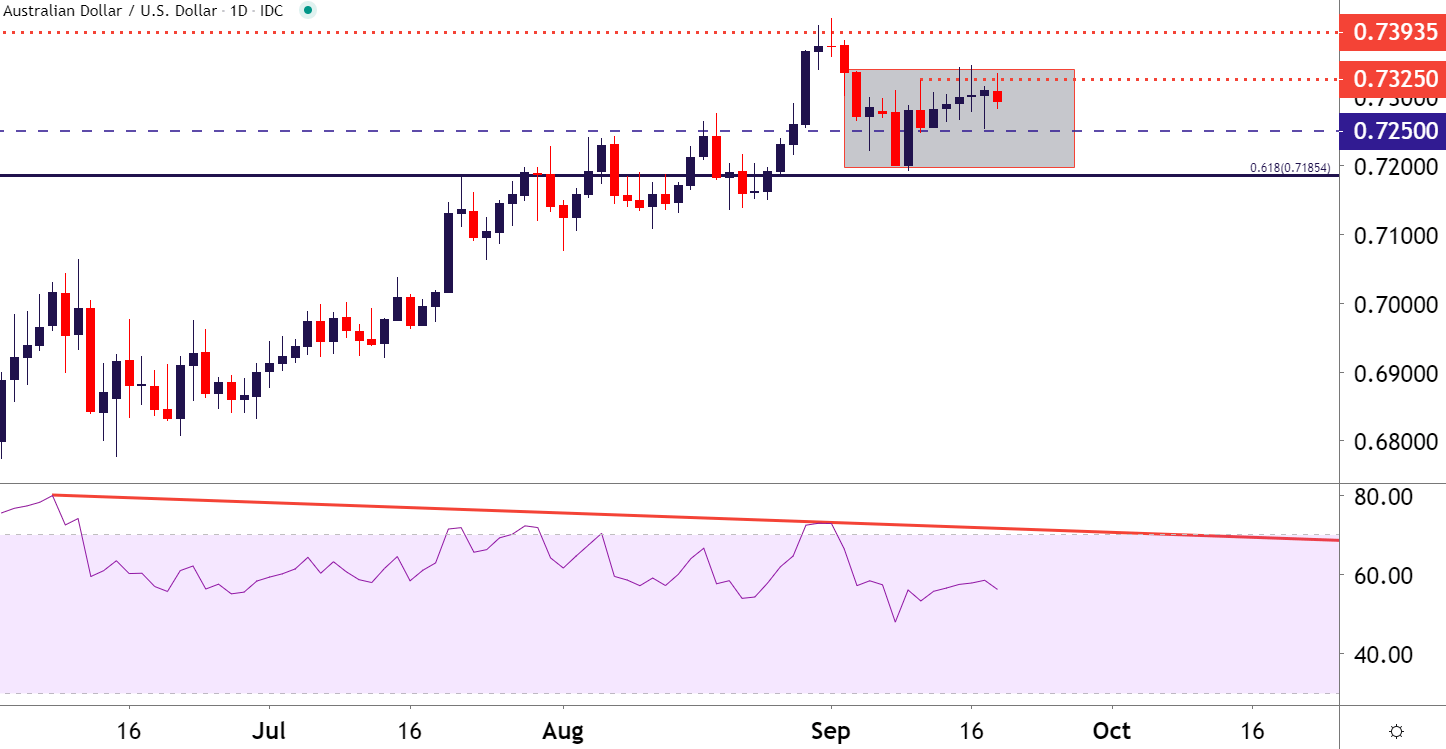
Chart prepared by James Stanley; AUD/USD on Tradingview
Taking an even shorter-term look at AUD/USD, and a potentially actionable formation appears on the four-hour chart. The digestion displayed over the past couple of weeks in the pair initially built as a rising wedge, as buyer support showed much more clearly around the lows that bullish drive appeared around highs. Such formations will often be approached with the aim of bearish reversals, and given the above criteria on both Weekly and Daily charts, that door may soon start to open in the pair.
Wednesday price action, around the FOMC rate decision, saw prices in the pair fall through the bottom of this formation on a trip down to the .7250 psychological level. That led to a Thursday bounce, with prices pushing up to find resistance around the projection of underside of that wedge. So – this is still very much a case of digestion but if trying to read between the lines, the bearish side of the pair can remain of interest in the week ahead.

The technical forecast for AUD/USD will be set to bearish for next week.
AUD/USD Four-Hour Price Chart

Chart prepared by James Stanley; AUD/USD on Tradingview
--- Written by James Stanley, Strategist for DailyFX.com
Contact and follow James on Twitter: @JStanleyFX


