


US Dollar, EUR/USD, AUD/USD Price Action Setups:
- The US Dollar was in a hard bearish trend in July and August.
- USD ran into a big area of support on September 1st, and since then buyers have been making their presence increasingly known.
- Below I look at USD, EUR/USD, GBP/USD and AUD/USD in the effort of devising strategy for the days/weeks ahead.
- The analysis contained in article relies on price action and chart formations. To learn more about price action or chart patterns, check out our DailyFX Education section.
USD Begins to Reverse as Q4 Open Nears
Well it finally happened – the US Dollar put in a bullish move after a summer that saw very little strength. The US currency was continually driving-lower as stimulus programs in the US kept the economy afloat, and the September open saw the currency drive down to a fresh two-year-low.
It was right around that time that a big zone of long-term, confluent support came into play as highlighted in this article on August 31st. This zone has Fibonacci retracements from two different long-term studies to go along with a trendline projection that can be found by connecting 2011 and 2014 swing lows. This thicket of support levels eventually helped to quell the declines.
US Dollar Monthly Price Chart
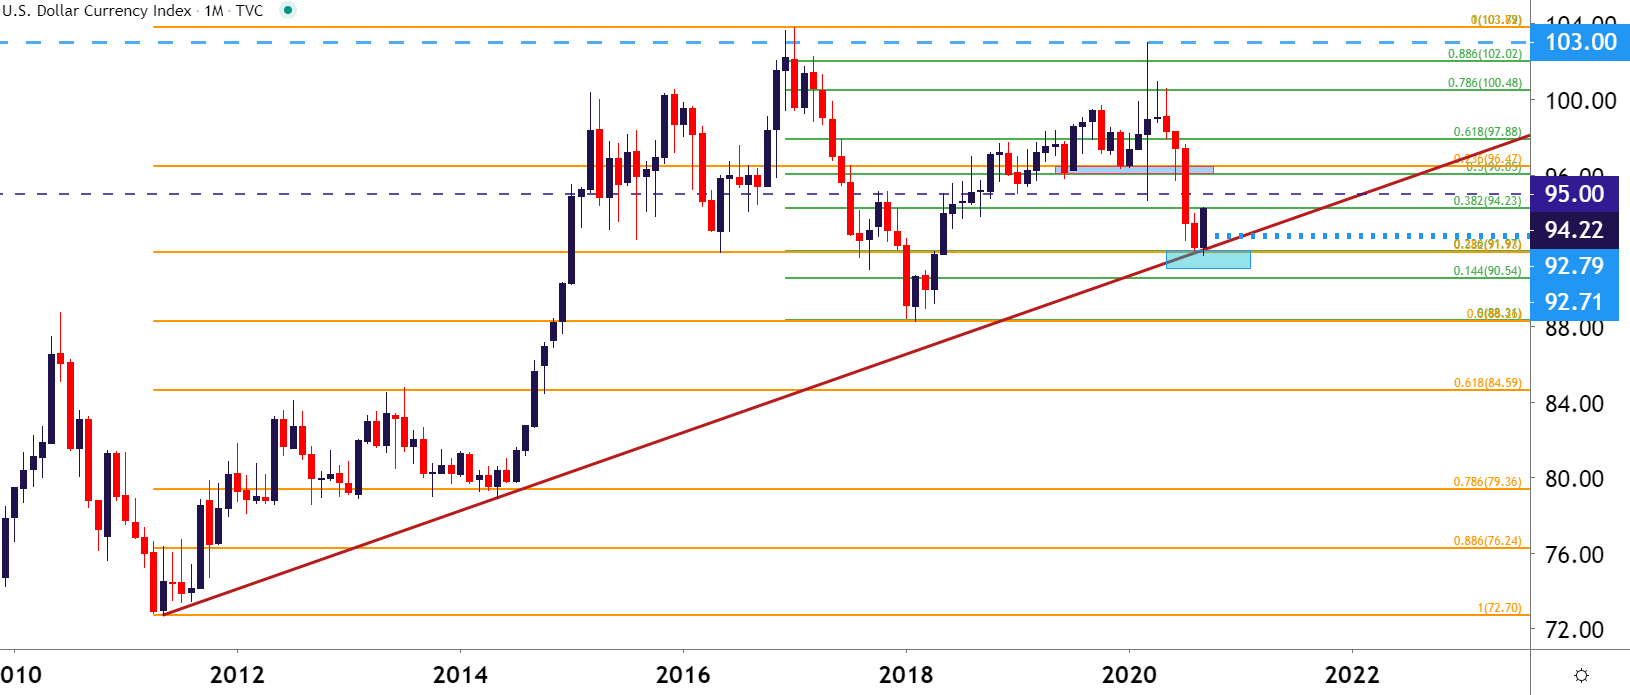
Chart prepared by James Stanley; USD, DXY on Tradingview
That support zone comes in around the ‘s3’ area that was looked at in the Q3 Technical forecast for the US Dollar, and with Q4 just around the corner, the operative question is whether this support can hold long enough to allow for the trend to shift.

At this point, from the Daily chart, that potential is there as price action has just pushed up to a fresh higher-high. The level of 94.23 is key, as this is the 38.2% retracement of the 2017-2018 major move, and this is from the same study with which the 23.6% marker helped to set that early-September support.
The big question at this point, with the Q4 open taking place next week – is which markets may be the most primed for a continuation of USD-strength or, perhaps, which might be most operative in the event that USD-weakness comes back into the equation. Below, I take looks at EUR/USD, AUD/USD and GBP/USD in the effort of devising strategy for the days/weeks ahead.
US Dollar Daily Price Chart
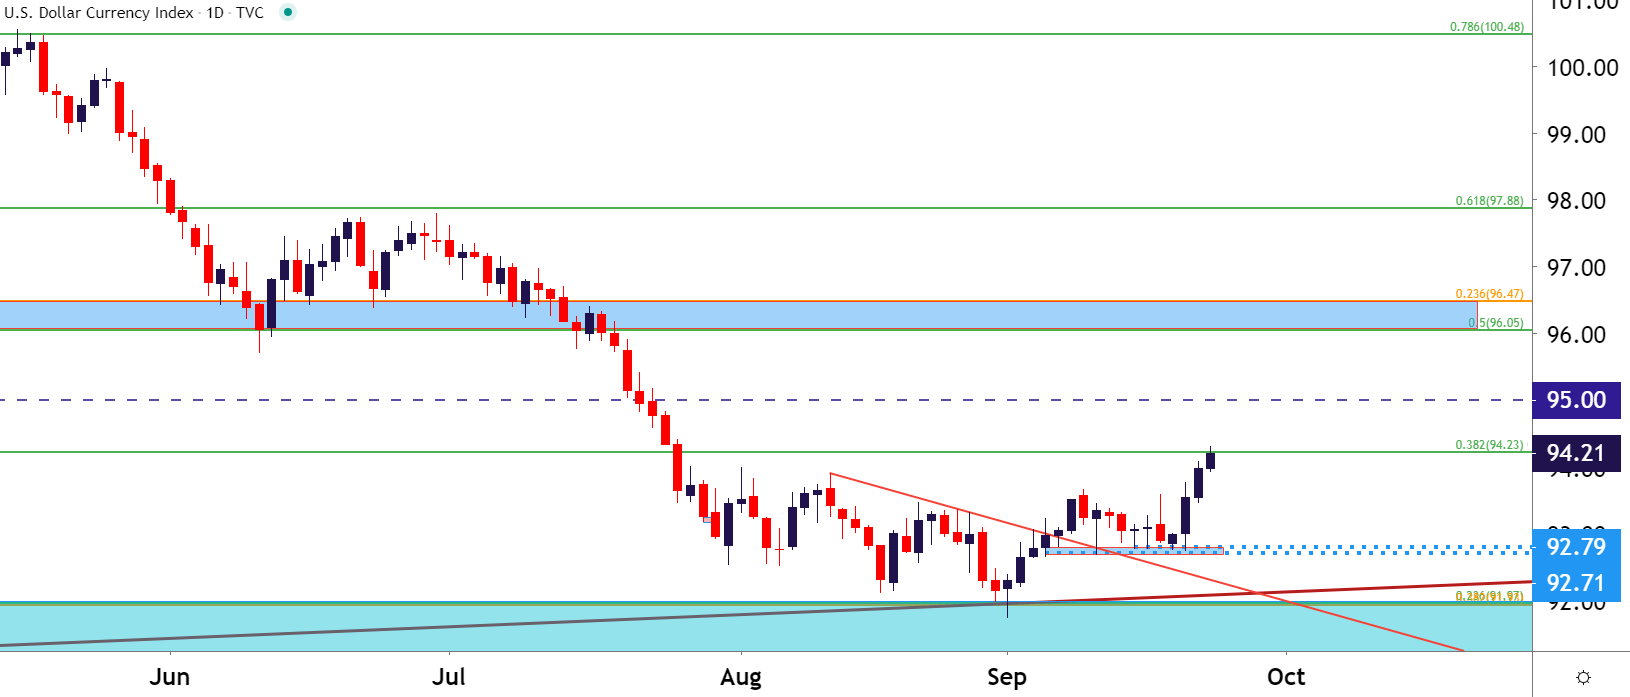
Chart prepared by James Stanley; USD, DXY on Tradingview
EUR/USD Breaks Support as Sellers Make Their Way
I wanted to address this pair first as it’s likely the focal point for those harnessing USD-strategies; and given the 57.6% allocation into DXY, it makes sense as to why.
I had looked at EUR/USD for long-USD strategies in early-August; largely on the basis of a resistance hold around the 1.2000 psychological level in the pair. That resistance came into play on September 1st and similar to USD, a reversal has started to show.

But – despite this recent breakdown below support and the seemingly increasing aggression from sellers, the chart looks as if there may be a bear trap brewing. Sellers have slowed over the past couple of days even with that support breaching – so this may be a scenario in which bearish strategies could be more attractive if/when price action checks back to find support around prior resistance. This plots around the 1.1750 psychological level and this zone caught numerous inflections over the past two months as EUR/USD built into a range. Most recently, this zone helped to set the low on Monday before sellers finally pushed-below on Tuesday.
But a pullback to this zone could re-open the door for bearish scenarios in the pair, allowing the trader to focus on bullish USD strategies through EUR/USD.
EUR/USD Eight-Hour Price Chart
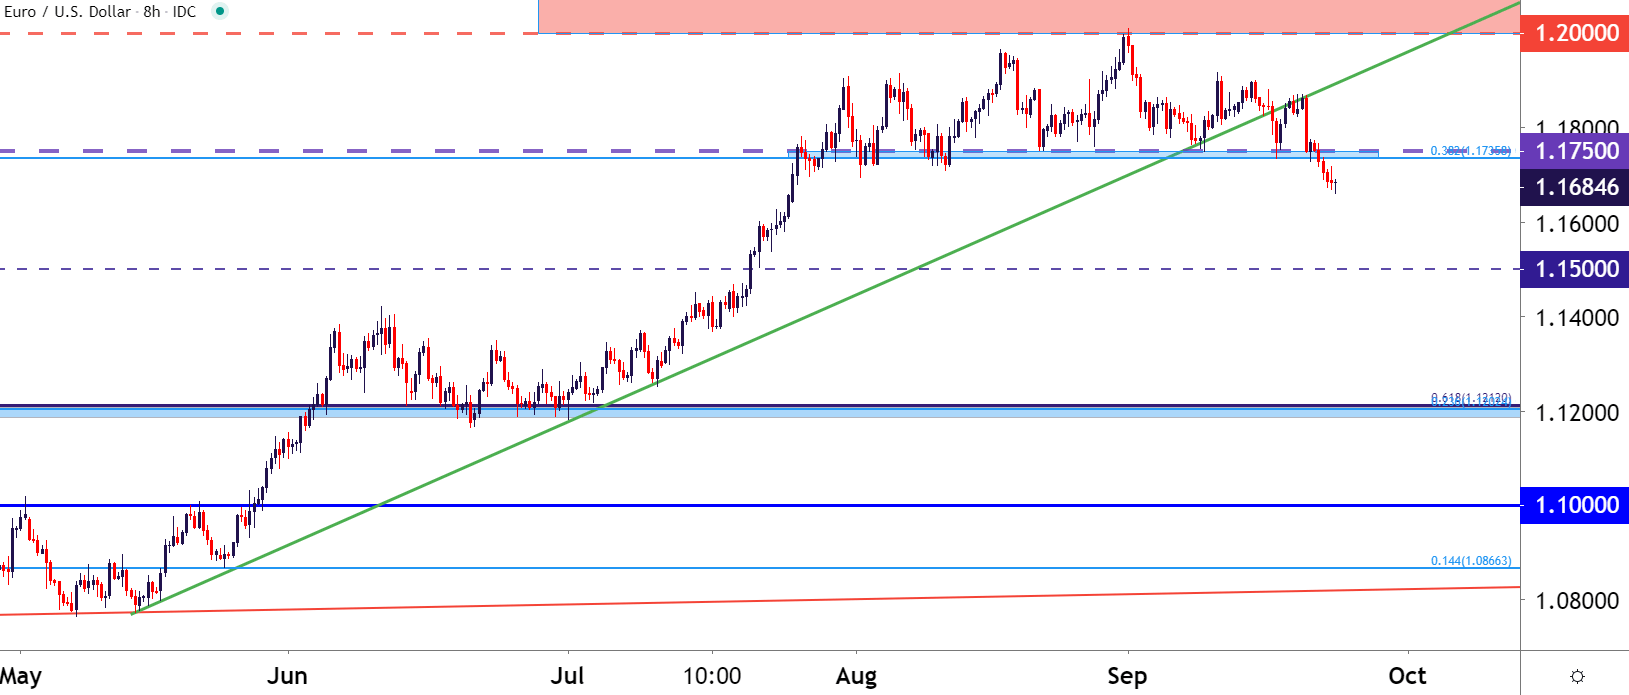
Chart prepared by James Stanley; EUR/USD on Tradingview
AUD/USD Begins Reversal, Big Figure Up Ahead
The bearish move in AUD/USD looks a bit more decisive than what was looked at above on EUR/USD. I had written about this setup in this week’s forecasts, aptly titled Australian Dollar Forecast: AUD/USD May be Setting Stage for Reversal.

The logic behind that setup was the build of a rising wedge formation going along with a potential trend shift. As I had written, the support zone around .7185 loomed large; but this has already been taken out. The next operative question is what’s next – and the big level looming on the chart at this point is the .7000 big figure. If this comes into play, there’s a very legitimate question as to whether the move is oversold at that point.
Alternatively, traders can take a patient approach by waiting to see if prior support is re-purposed as future resistance. This plots around .7185-.7205.
AUD/USD Eight-Hour Price Chart
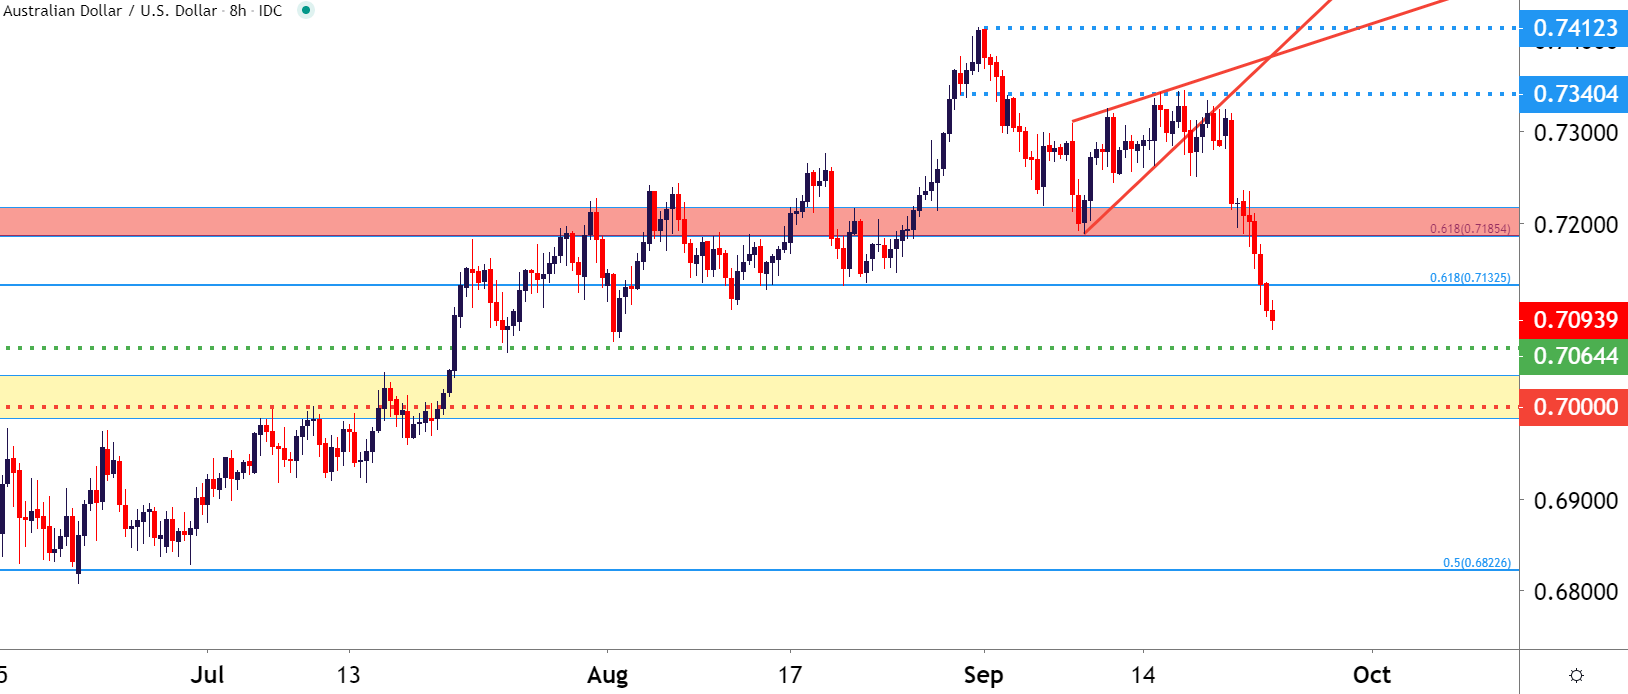
Chart prepared by James Stanley; AUD/USD on Tradingview
GBP/USD Smashed, Finally Finds Support
It’s been a tough week in the UK, and in the British currency it’s been a difficult month of September. After topping-out just under the 1.3500 handle, sellers pounced and as a negative combination of Brexit and coronavirus headlines shifted the narrative for the UK.
What is interesting is the fact that both EUR/USD and AUD/USD looked at above remain in full-fledged sell-offs while GBP/USD has apparently caught a bit of support. This comes in around 1.2712, which is the 61.8% Fibonacci retracement of the major move from the December high to the March low. So far, that level has helped to hold sellers at bay, and this brings up the possibility for pullback scenarios, particularly with the scope of USD-weakness.
GBP/USD Eight-Hour Price Chart

Chart prepared by James Stanley; GBP/USD on Tradingview
--- Written by James Stanley, Strategist for DailyFX.com
Contact and follow James on Twitter: @JStanleyFX


