


US Dollar Price Forecast:
- The US Dollar has lost as much as 5.4% in a little less than two months.
- Last week saw the currency push down to a fresh two-year-low; but sellers weren’t able to hold on to the move as prices quickly jumped back to the 93-handle.
- The big question at this point is whether USD bears may have capitulated last week, suggested by the long wick sitting underneath price action on the weekly chart.
- This article incorporates price action to help spot that potential for capitulation. To learn more about price action, check out our DailyFX Education section.
Did USD Bears Just Throw in the Towel (for now)?
It’s been a pretty rough Q3 so far for the US Dollar, and with a little over a month to go quite a bit remains unsettled in the backdrop. Next quarter brings what’s expected to be a highly-contentious US Presidential Election, and this will take place as a global pandemic continues to run in the United States. While the impact from the coronavirus was priced-in heavily in February and March, the backdrop since has been considerably less threatening, due in large part to the plethora of stimulus programs triggered by the Fed, the US Treasury and even Congress.
The cumulative effect of all that USD-printing has been a weaker US Dollar; and the Greenback has lost as much as 5.4% in a little less than two months.

While the short side of the Greenback was the focus in the Q3 Technical Forecast for the USD (linked above), few could’ve projected how quickly this would come-in. The question must now be asked as to whether the move is over-extended; and whether a pullback is waiting in the wings.
At issue is a big zone of longer-term support in DXY. This was looked at a few weeks ago as the USD sell-off appeared to begin slowing; and sure enough, last week’s price action in the US Dollar produced a doji after a quick push down to fresh two-year-lows. That bearish breakout ended up showing as false with price action quickly jumping back-above the 93-handle; highlighting the potential for last week’s failed bearish breakout to be a sign of capitulation from sellers after a two-month-run of control in the currency.
US Dollar Weekly Price Chart

Chart prepared by James Stanley; USD, DXY on Tradingview
USD: Key Confluence Sets the Stage for Support
Just below current price action, and potentially a reason for capitulation last week, is a zone of confluent support around the 92-handle. Within tight proximity this area contains both the 50% marker of the 2011-2017 major move along with the 23.6% retracement of the 2017-2018 major move. This price hasn’t been in-play on the US Dollar since April of 2018; and it almost came into the equation last week before sellers pulled back, buyers showed up and prices began to trend-higher.

US Dollar Monthly Price Chart: A Key Zone of Confluence
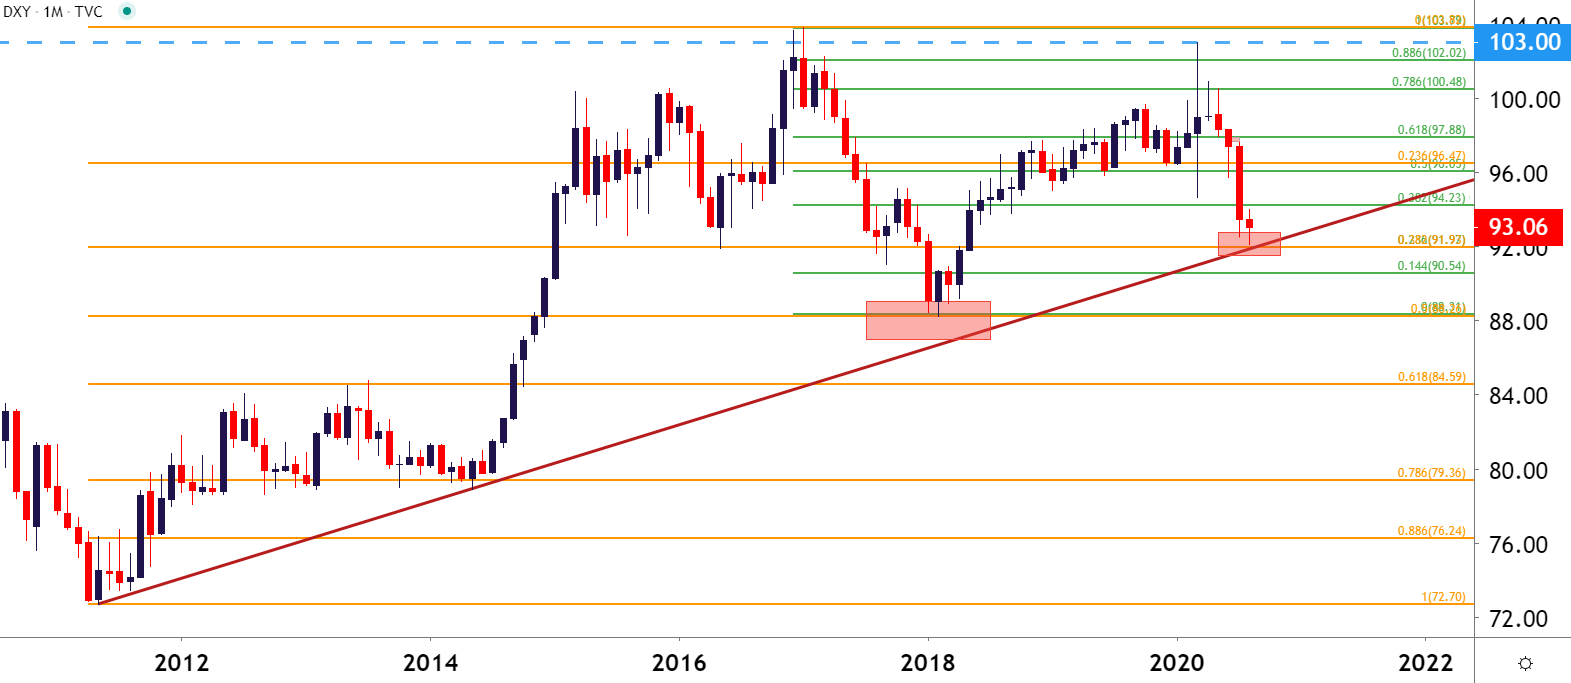
Chart prepared by James Stanley; USD, DXY on Tradingview
US Dollar Strategy Near-Term
Going down to a shorter-term chart, there appears to be a bit of tepidness from buyers as prices have continued with higher-lows but, have seemed to calm around the 93.25-93.40 area. So, while the backdrop may not be as bearish as it was a week ago given the potential for capitulation last week, the trend also isn’t yet bullish. It could soon be, however, if buyers can continue to stage a series of higher-highs to go along with those higher-lows, and this adds emphasis to the 93.50 area on the chart, which had previously helped to set support in late-August. A breach above this level opens the door for a re-test of the 94.00 handle; and if that should quickly come into the equation, there’s another key zone just a little higher on the chart.
This zone runs from the 96-handle up to around 96.47. This area caught numerous support inflections over the past fourteen months. But, to date, there hasn’t been much for resistance here. This could make for an interesting scenario in Q4 should that zone come into play, in which the door may soon re-open for bears, after an approximate 38.2% Fibonacci retracement of the 2020 sell-off.
US Dollar Daily Price Chart
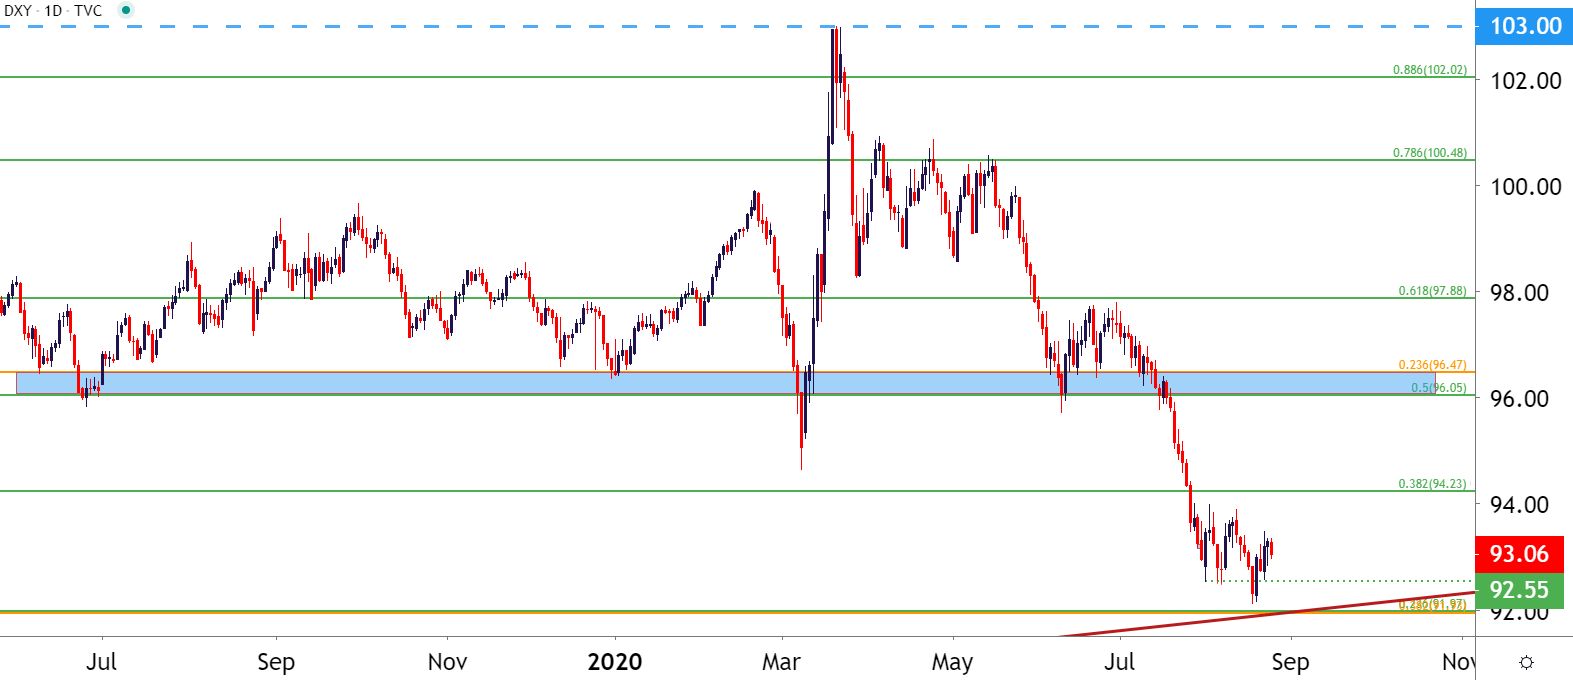
Chart prepared by James Stanley; USD, DXY on Tradingview
--- Written by James Stanley, Strategist for DailyFX.com
Contact and follow James on Twitter: @JStanleyFX


