


- Australian Dollar sinks to weekly support - looking for price stabilization into October open
- Check out our 2019 projections in our Free DailyFX USD Trading Forecasts
- Join Michael for Live Weekly Strategy Webinars on Mondays at 12:30GMT
The Australian Dollar is fractionally lower against the US Dollar this week with Aussie trading at 6760 ahead of the New York close on Friday. A second consecutive weekly decline takes price back below a key pivot range and we’re looking for support early in October IF Aussie is to have any hope of mounting a counteroffensive. Here These are the updated targets and invalidation levels that matter on the AUD/USD weekly price chart. Review my latestWeekly Strategy Webinar for an in-depth breakdown of this Aussie price setup and more.
New to Forex Trading? Get started with this Free Beginners Guide
Australian Dollar Price Chart – AUD/USD Weekly
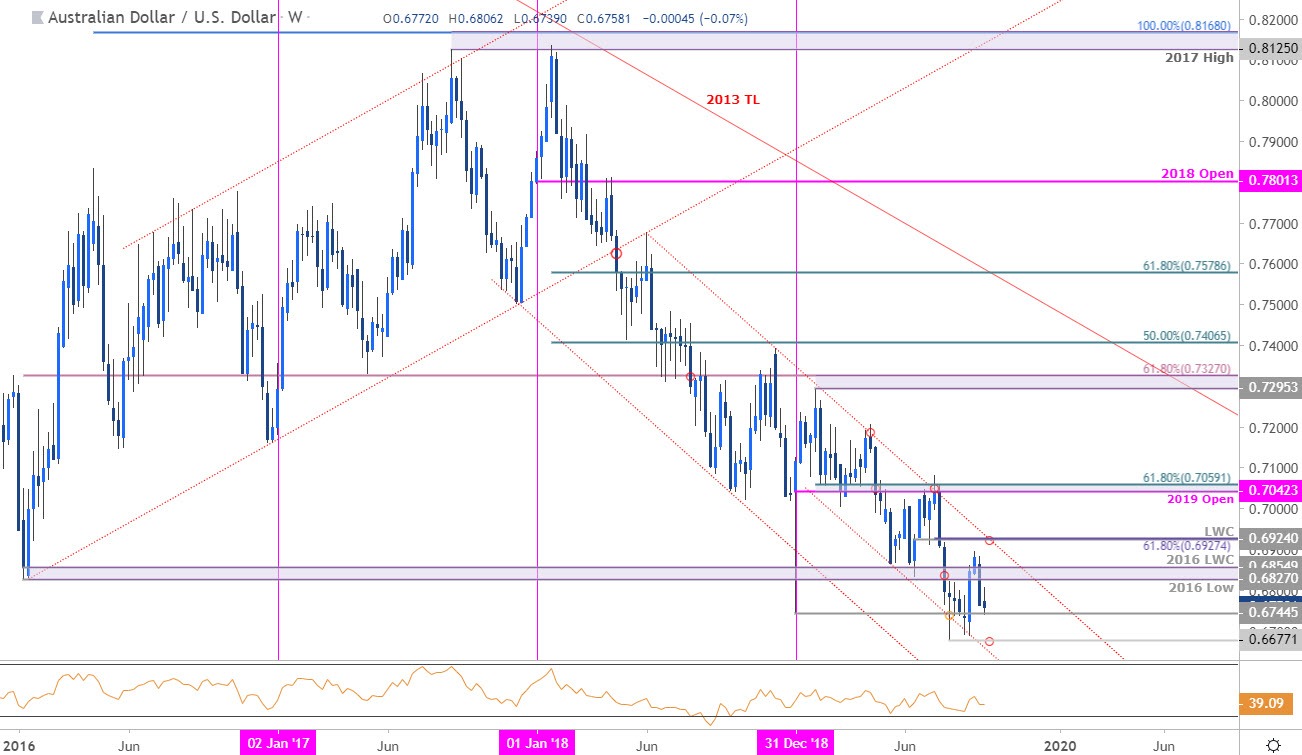
Chart Prepared by Michael Boutros, Technical Strategist; EUR/USD on Tradingview
Notes:In my last Aussie Weekly Price Outlook we noted that, “Aussie turned off slope support this week and we’re looking for price to stabilize above 6745 for this advance to get some legs.” Price rallied nearly 3% off the lows to register a high at 6894 before reversing with the decline testing support this week at the January lows at 6745- it’s make-or-break heading into the start of October trade.
A downside break below this threshold would shift the focus back towards the yearly lows at 6677 and channel support. Initial resistance stands at the 2016 low / low-week close at the 6827/54 pivot zone - ultimately a breach / close above the 61.8% retracement of the July decline / June low-week close at 6924/27 is needed to suggest a larger trend reversal is underway targeting yearly open resistance above the 70-handle.
For a complete breakdown of Michael’s trading strategy, review his Foundations of Technical Analysis series on Building a Trading Strategy
Bottom line:Aussie will need to stabilize into the start of October trade IF the September advance is to remain viable. From a trading standpoint, be on the lookout for an exhaustion low early next month with a breach above the June 2018 trendline needed to suggest a more significant low was registered in Q2. Review my latest Australian Dollar Price Outlook for a closer look at the near-term AUD/USD technical trading levels.
Australian Dollar Trader Sentiment – AUD/USD Price Chart
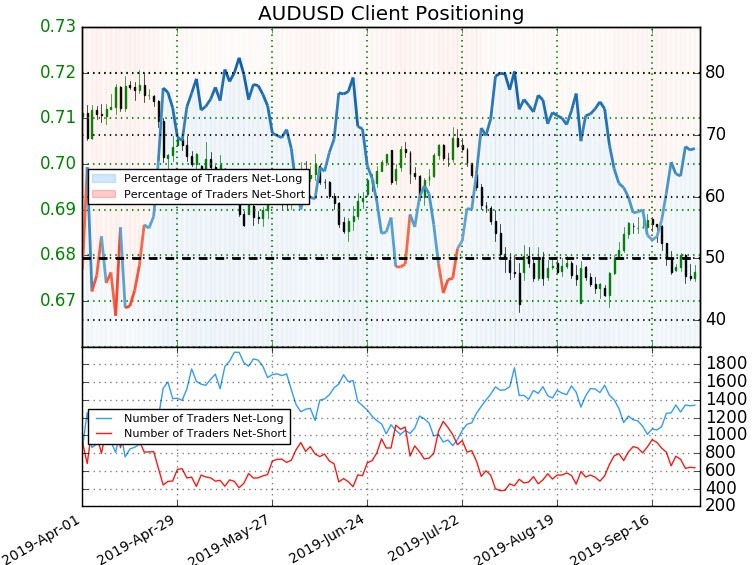
- A summary of IG Client Sentiment shows traders are net-long AUD/USD- the ratio stands at +2.11 (67.8% of traders are long) – weak bearishreading
- Traders have remained net-long since July 19th; price has moved 2.4% lower since then
- Long positions are3.4% lower than yesterday and 8.1% higher from last week
- Short positions are 6.5% lower than yesterday and 26.3% lower from last week
- We typically take a contrarian view to crowd sentiment, and the fact traders are net-long suggests AUD/USD prices may continue to fall. Traders are further net-long than yesterday & last week, and the combination of current positioning and recent changes gives us a stronger AUD/USD-bearish contrarian trading bias from a sentiment standpoint.
See how shifts in Aussie retail positioning are impacting trend- Learn more about sentiment!
---
Previous Weekly Technical Charts
- Gold (XAU/USD)
- Crude Oil (WTI)
- Euro (EUR/USD)
- Canadian Dollar (USD/CAD)
- Japanese Yen (USD/JPY)
- US Dollar Index (DXY)
Learn how to Trade with Confidence in our Free Trading Guide
--- Written by Michael Boutros, Technical Currency Strategist with DailyFX
Follow Michael on Twitter @MBForex


