


Gold Price Threatens Major Break After Bears Thwarted at Lows
Gold Talking Points:
- Gold Price Outlook: Gold Recovery Continues – Are Sellers Finished?
- Gold Prices Coil within Two-Week Range After US NFP Letdown.
Gold Price Technical Forecast: Bullish
Gold Holds Support at 2019 Lows
It’s been another busy week for Gold prices after last week’s breakdown to fresh 2019 lows. And while no new highs or lows were established this week – there may be a number of deductions that traders can move-forward with on the yellow metal. In this piece, I’m going to take a tops-down look at Gold prices, incorporating the monthly chart to focus on what got us to our current levels, and then drilling down to shorter-term variations in the effort of devising strategy. But, first and foremost – an identification of the current state of Gold prices, which is a symmetrical wedge formation that’s been building since the Q3 of last year. This formation will often lend itself to breakouts that can run for a while, as the digestion exhibited inside of the formation gives way to elongated trends.
Gold Price Daily Chart
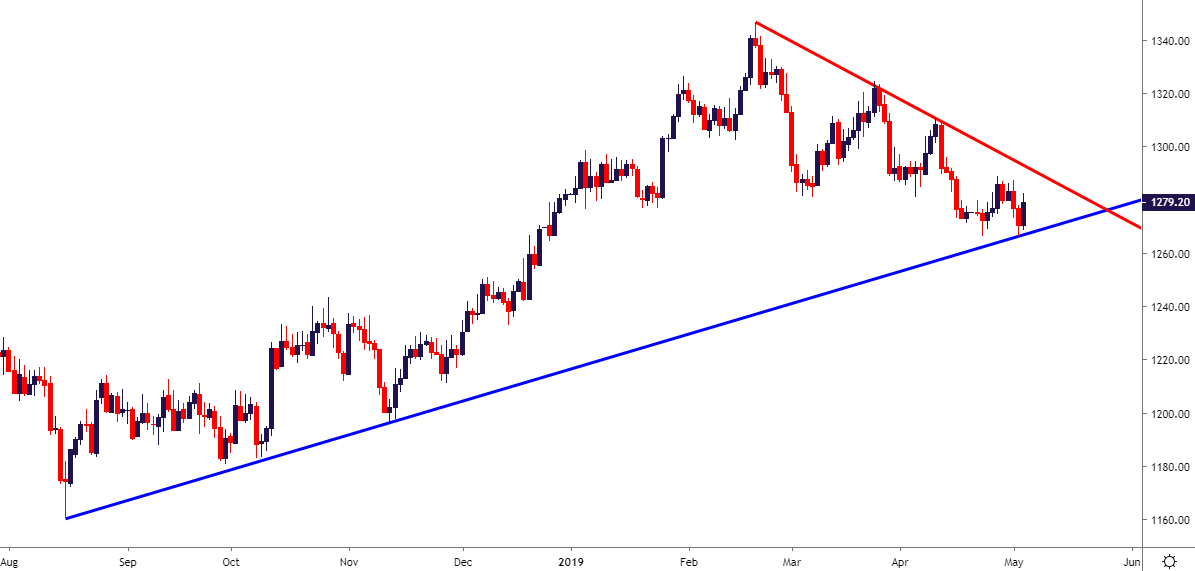
Chart prepared by James Stanley
On a longer-term basis, Gold prices have been in a state of digestion for the past couple of years. This comes after the bullish ramp that started from the lows in 1999 all the way up to the 2011 high. During this span of time, Gold prices appreciated all the way from the 253.90 level to a 2011 high of 1920.94; a move of 757.4%. From 2012-2015, a little more than 50% of that move was retraced, and prices pushed back-down to a 2015 low of 1046.54. The first half of 2016 brought a strong rally that saw prices elevate back-up to 1375; but since then, price action has continued to digest while building in a symmetrical wedge formation.
Gold Price Monthly Chart

Chart prepared by James Stanley
Within that longer-term symmetrical wedge looked at above, a number of short-term trends have developed. Notable from recent price action is a down-trend that ran from April of last year into August. Prices fell from above 1360 to below 1170 in a very short period of time, with support catching in mid-August of last year. That support build led into a strong bullish move that ran into February of this year, with highs printing around the 1340 level on the chart.
Gold Price Weekly Chart
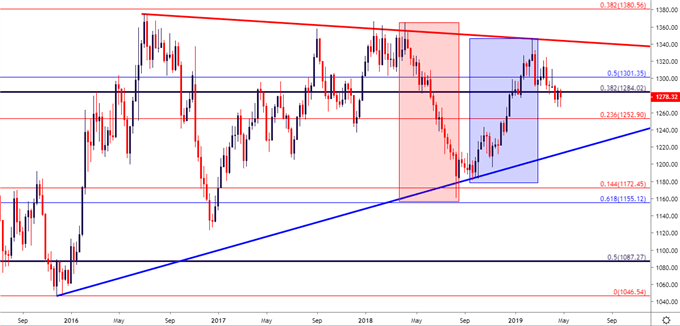
Chart prepared by James Stanley
Going down to the Daily chart, another formation of digestion shows, and that’s a symmetrical triangle that’s built from the August 2018 lows and the February 2018 highs. This is the same setup looked at in the very first chart in this article, and this is a case of digestion within digestion, which can lead to a very large move once the impasse gives way.
Gold Price Daily Chart

Chart prepared by James Stanley
Gold Price Forecast: Bullish
In such scenarios, in which digestion is showing inside of digestion, a directional bias can be a challenge. For next week, the forecast for Gold prices will be set to bullish for two reasons: The first, and perhaps most important is the fact that bears had ample opportunity to push down to fresh lows this week and were unable to do so. The area in which support built was a key spot on the chart, and this could carry value into next week’s trade. The second, and this is based more off of projections, but the US Dollar put in a bearish engulfing candle on Friday after NFP, and that comes after USD-bulls were rebuffed at resistance. This further keeps the topside of Gold as interesting.
To read more:
Are you looking for longer-term analysis on the U.S. Dollar? Our DailyFX Forecasts for Q2 have a section for each major currency, and we also offer a plethora of resources on USD-pairs such as EUR/USD, GBP/USD, USD/JPY, AUD/USD. Traders can also stay up with near-term positioning via our IG Client Sentiment Indicator.
Forex Trading Resources
DailyFX offers an abundance of tools, indicators and resources to help traders. For those looking for trading ideas, our IG Client Sentiment shows the positioning of retail traders with actual live trades and positions. Our trading guides bring our DailyFX Quarterly Forecasts and our Top Trading Opportunities; and our real-time news feed has intra-day interactions from the DailyFX team. And if you’re looking for real-time analysis, our DailyFX Webinars offer numerous sessions each week in which you can see how and why we’re looking at what we’re looking at.
If you’re looking for educational information, our New to FX guide is there to help new(er) traders while our Traits of Successful Traders research is built to help sharpen the skill set by focusing on risk and trade management.
--- Written by James Stanley, Strategist for DailyFX.com
Contact and follow James on Twitter: @JStanleyFX
Other Weekly Technical Forecast
Australian Dollar (AUD) Outlook: AUDUSD Still Looking Into The Abyss?
Crude Oil Weekly Technical Forecast: Support May Soon Lead to Rally
Pound Surge Has GBPUSD Range to Run, But Resistance Coming in Elsewhere
US Dollar Price Forecast: Whose Brave Enough To Short DXY in May?


