


Gold Price Talking Points:
- Gold prices have had a busy month of April, and the past two weeks have been especially climactic as Gold prices broke down to a fresh 2019 low a week ago, caught support on a bullish trend-line, and have since started to reverse.
- Gold prices are threatening a re-test of the 1295 area of prior support and if bulls can push through there, buyers may be able to make their mark. Accenting the backdrop for the remainder of this week is a very busy economic calendar, and perhaps thickening the drama is t he fact that retail traders appear to be heavily expecting a continued recovery in Gold prices.
- DailyFX Forecasts are published on a variety of currencies such as the US Dollar or the Euro and are available from the DailyFX Trading Guides page. If you’re looking to improve your trading approach, check out Traits of Successful Traders. And if you’re looking for an introductory primer to the Forex market, check out our New to FX Guide.
Do you want to see how retail traders are currently trading Gold prices? Check out our IG Client Sentiment Indicator.
Gold Prices Rally to Fibonacci Resistance a Week After Fresh 2019 Lows
Gold prices are rallying today, extending the week-long bullish move after Gold prices set a fresh low around trend-line support. It was just a week ago that Gold prices were purging down to fresh 2019 lows, breaking below a batch of support that had held multiple support inflections already this year. But that bearish breakout had very little room to run, and since then, Gold prices have put in a respectable effort of building support and pushing-higher on the charts.
Gold Price Two-Hour Chart
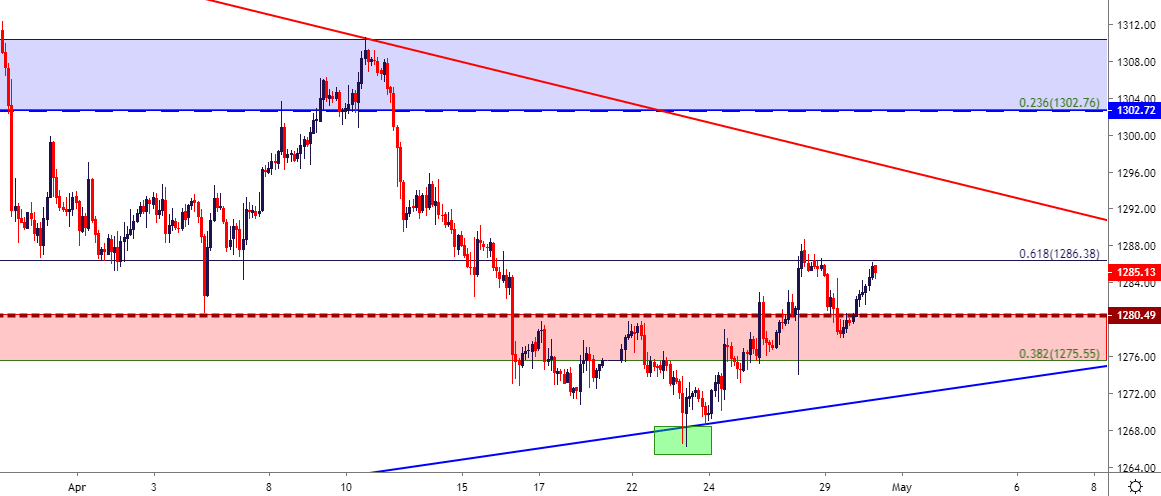
Chart prepared by James Stanley
Interestingly, this rally in Gold prices has shown through a couple of different themes in the US Dollar. Gold prices remained bid as the US Dollar was breaking out to fresh highs last week. And as the US currency pulls back today, Gold prices are still moving higher, indicating that there may be a turn of sorts that is currently pricing-in through Gold markets.
In last Thursday’s piece on Gold prices, I outlined this specific price at 1286.38, highlighting how a test here could re-open the door for bullish strategies in the pair. That test showed up on Friday, and this week opened with a pullback down to a key zone, at which point buyers returned and since then, prices have rallied back to 1286.38. This keeps the door open for short-term bullish strategies in Gold, plotting a return to the bearish trend-line that currently plots to around 1295-1296.
Gold Price Four-Hour Chart

Chart prepared by James Stanley
On a longer-term basis, the big question is whether sellers are finished. Gold prices had a strong six-month-run from August to February, and the past two months have seen a general tone of retracement as prices have given back 38.2% of that move. But – that 38.2% Fibonacci retracement at 1275.55 helped to hold the lows, at least for now, and already buyers are back on the bid. A break-above the bearish trend-line exposes another prior zone of interest, and this runs from 1302 up to 1310. A test here denotes a bullish break of the bearish trend-line, and a hold above the 1300 psychological level can begin to re-open the door for longer-term strategies in Gold prices.
The fact that sellers weren’t or haven’t been able to make much ground is notable, as this produces the makings of a falling wedge pattern, which will often be approached in a bullish manner, driven by the fact that bears were far more shy at the lows than they were at the highs. This denotes more of a pullback theme rather than a reversal and, at least for now, this can help to keep bullish prospects around the yellow metal as the door soon opens into the month of May.
Gold Price Daily Chart
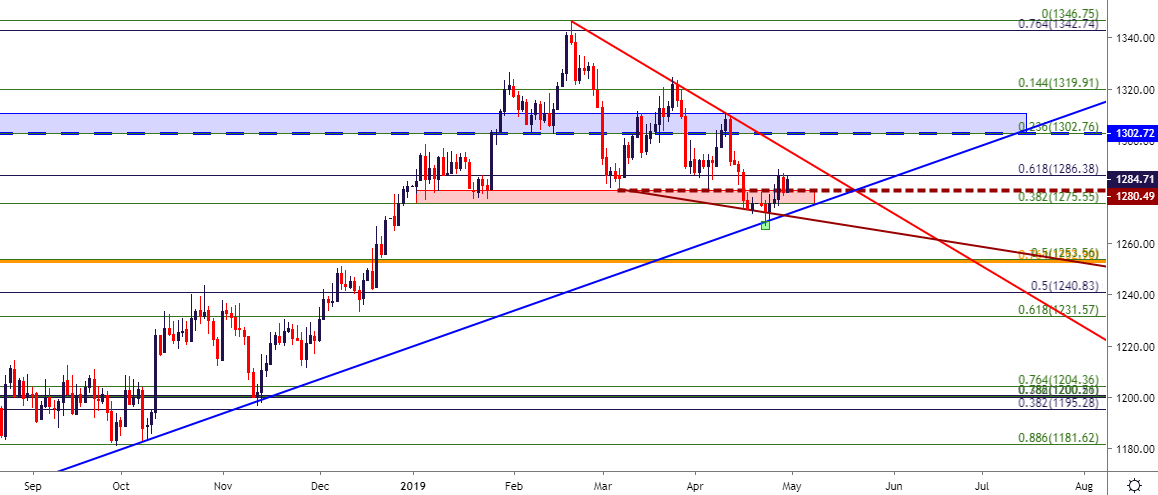
Chart prepared by James Stanley
To read more:
Are you looking for longer-term analysis on the U.S. Dollar? Our DailyFX Forecasts for Q2 have a section for each major currency, and we also offer a plethora of resources on USD-pairs such as EUR/USD, GBP/USD, USD/JPY, AUD/USD. Traders can also stay up with near-term positioning via our IG Client Sentiment Indicator.
Forex Trading Resources
DailyFX offers an abundance of tools, indicators and resources to help traders. For those looking for trading ideas, our IG Client Sentiment shows the positioning of retail traders with actual live trades and positions. Our trading guides bring our DailyFX Quarterly Forecasts and our Top Trading Opportunities; and our real-time news feed has intra-day interactions from the DailyFX team. And if you’re looking for real-time analysis, our DailyFX Webinars offer numerous sessions each week in which you can see how and why we’re looking at what we’re looking at.
If you’re looking for educational information, our New to FX guide is there to help new(er) traders while our Traits of Successful Traders research is built to help sharpen the skill set by focusing on risk and trade management.
--- Written by James Stanley, Strategist for DailyFX.com
Contact and follow James on Twitter: @JStanleyFX


