Pound Technicals Talking Points:
- Brexit remains the key to Sterling’s ability to stoke trend or hold congestion, and it is yet unresolved
- GBPUSD posted its biggest single-day rally Friday in 7 weeks and best week’s rally in 3 months
- See how retail traders are positioned in GBPUSD, EURGBP, gold, oil, indices and key FX pairs in real time
Technical Forecast for Gold Prices: Neutral
The British Pound was already hosting a bullish advance this past week when the currency received a strong boost through Friday’s session. The volatility and uniform direction are unmistakable, but how confident should we be that this charge will sustain itself? To evaluate that, we should first take a minute to appreciate just how remarkable this past week’s performance was in historical terms. Using GBPUSD as our benchmark, Friday’s charge was the largest single-day rally for the benchmark pair since March 13th while the week’s aggregate performance was the most bullish since the same general period. That is a loaded comparison of course, because March 13th was the end of the pair’s volatile and reversal-plagued move higher. Normally, I deemphasize making straight line comparisons to such distinct technical events; but there is some contextual relevance here that traders should note.
While there was significant technical resistance for the market to respond to around 1.3375 back in early March between a rising trendline (that originated with July highs) and the midpoint to the 2018-2019 bear wave, the hold was as much a reflection of market conditions as it was the particular heft of that technical figure. The past year for the Sterling-at-large has held to frustrating range. Given the state of the global financial conditions and the lack of commitment across a variety of assets, this is not unique. However, the curbs on the Pound crosses – as well as the oscillations in volatility – is unmistakably derived from the currency itself. Even purist technicians would be remiss to ignore the importance of Brexit. In general, there are a few aspects to the theme that can shape the landscape. So long as the UK and EU are unclear on their separation, there will more likely be a general sense of congestion. Also, when there are key updates on its progress – or lack thereof – we are more likely to experience volatility (convenient for scheduled events). Much of what we registered last week was Brexit charged, and thereby carries a certain shelf life.
Chart of GBPUSD (Daily)
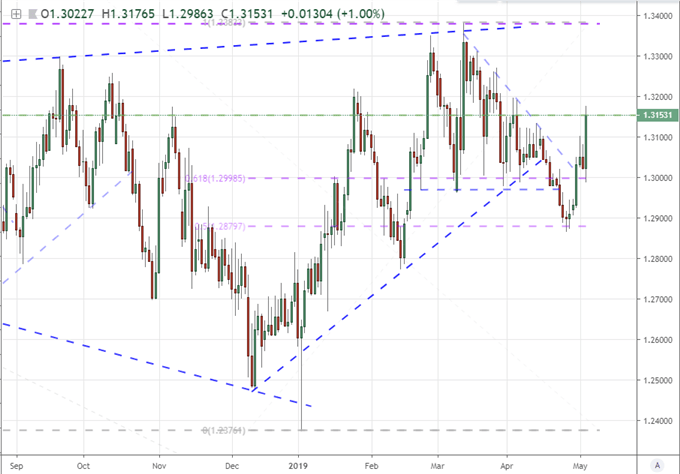
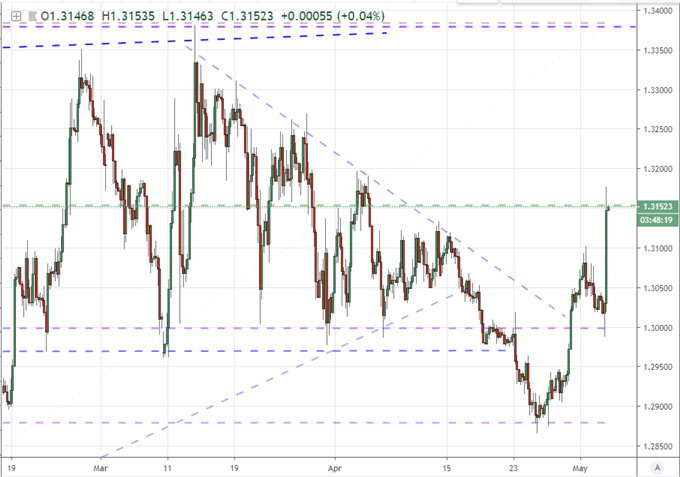
While there may be limits to the drive behind the Sterling as the spark of motivation dissipates into the next week, that wouldn’t necessarily halt the move in its tracks. If we are dealing with a range like the one we see in GBPUSD, traversing that established pattern is significantly easier than forcing a breakout or extending a trend. For this pair, the failed breakdown below 1.2975 and subsequent reversal back above 1.3000 generated a certain degree of speculative leverage and follow through. We have since cleared the 1.3125 midpoint of this March-to-April range and the 61.8% Fibonacci retracement of the same pattern stands around 1.3185. Considering the midpoint of the post-Brexit range from 2016 to 2018 at 1.3150 seems to offer little restriction, I don’t consider any of these interim boundaries too capable at halting the advance. That said, making it back up to 1.3350/75 is likely to prove far more difficult than we can assess from this chart alone.
Chart of GBPUSD (4 Hour)
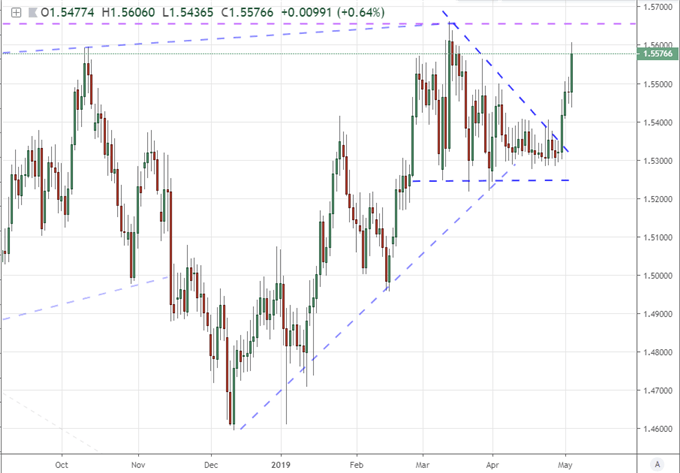
One of the imperceptible limitations on the Cable extending its run into next week is the close proximity to resistance that many other Sterling pairs currently find themselves. If we look more to the British Pound’s own technical bearings through a synthetic, equally-weighted index (below); we find that the market is very close to the highs shaped across its pairings back in early March – which also happens to be very close to the October peak. With enough dedicated Dollar selling, GBPUSD could overcome this unseen cap; but the general lack of drive from the Greenback itself suggests that is not an external driver to rely upon.
Chart of an Equally-Weighted Pound Index (Daily)
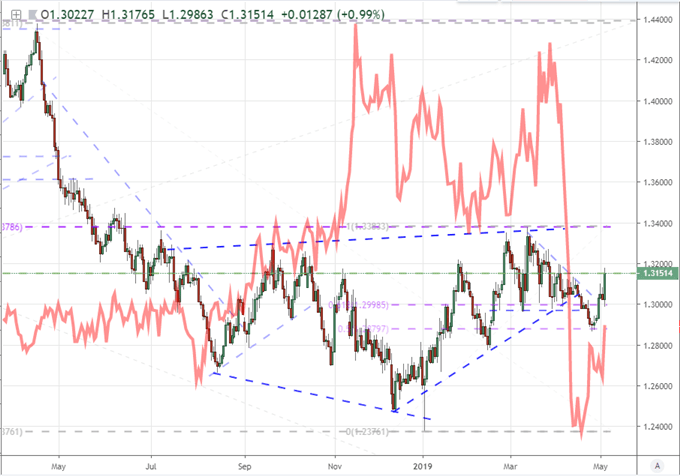
Whether we are looking at GBPUSD, EURGBP or any of the other Sterling crosses, it is important keep tabs on the expected volatility behind the market. Should we continue to see a high level of uncertainty and countdowns to further critical dates for Brexit as we have in previous months, the charge in implied volatility can generate more dramatic swings within the congestion, widen the range and even produce false breakouts. Should it deflate – as it did after the extension of the Article 50 date was approved – the intensity and frequency of those swings will deflate. Recently, we have seen the CME’s Pound Volatility Index recover lost ground, but that only puts us back into the range seen through the third quarter of 2018.
Chart of GBPUSD Index Overlaid with CME’s Pound Volatility Index (Daily)
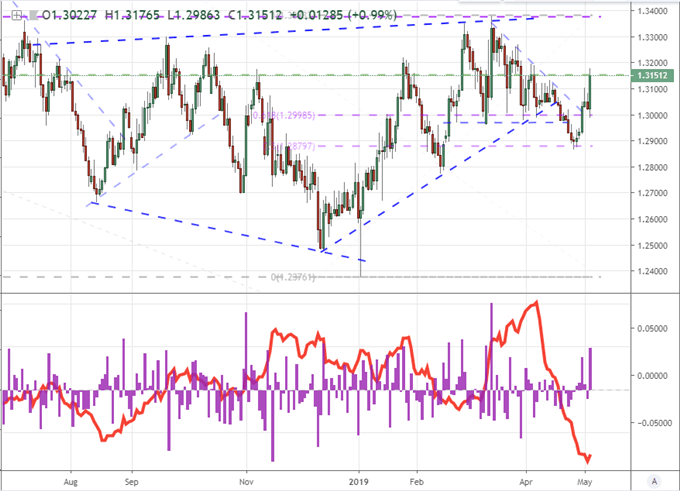
Another angle on volatility that is distinct from the expected measure from the CME is historical (or ‘realized’) activity measures for context. Below, we have the one-day rate of change and the 20-day average true range (ATR). With the latter measure reflecting on a trading month worth of price action, we can tell whether the markets are relatively too active or too quiet. Clearly, we have experienced the latter condition with the reading the lowest since the Summer of 2014, whereas were standing at an 11-month high in activity only a month earlier. When volatility is too low, it prompts short-term breakout scenarios; but a sustained climb in activity is not necessarily a lasting shift.
Chart of GBPUSD with Daily Rate of Change in Purple and 20-Day ATR in Red (Daily)
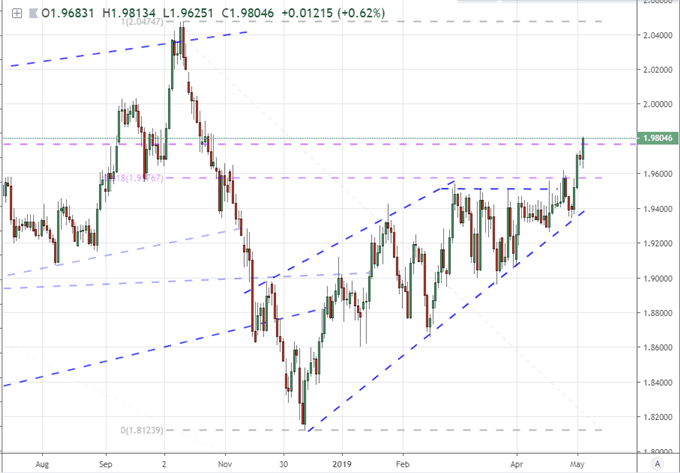
Having referenced the Sterling’s general bearings, there are some interesting technical patterns throughout the Pound crosses. One that stands out as particularly unique is the GBPNZD. It too was pushed to a break like the Cable this past week, but its run registers more as a continued trend than a passive move back into range. That could act as a cap and encourage an accelerated reversal relative to other pairs should the broader market cool. If you do watch this pair, be mindful into Wednesday when the RBNZ (Reserve Bank of New Zealand) rate decision announces its monetary policy decision. Watch this event live and see what other scheduled webinars are following critical event risk in the week ahead on the DailyFX Webinar calendar.
Chart of GBPNZD (Daily)
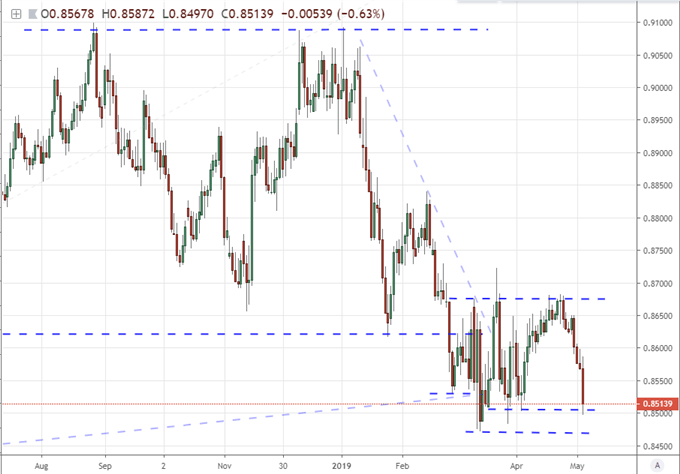
Very different from the Sterling’s open range and GBPNZD’s attempt to defy gravity with a trend, EURGBP is very much the range-bound pair. After experiencing the same acceleration through the end of this past week, EURGBP ended Friday around 0.8500 – within the zone of support the pair established through March after failing to make a significant run out of the break below two-year range support at 0.8625. While activity levels here can be very quiet, clarity and Pound pips can compensate for the patience necessary.
Chart of EURGBP (Daily)
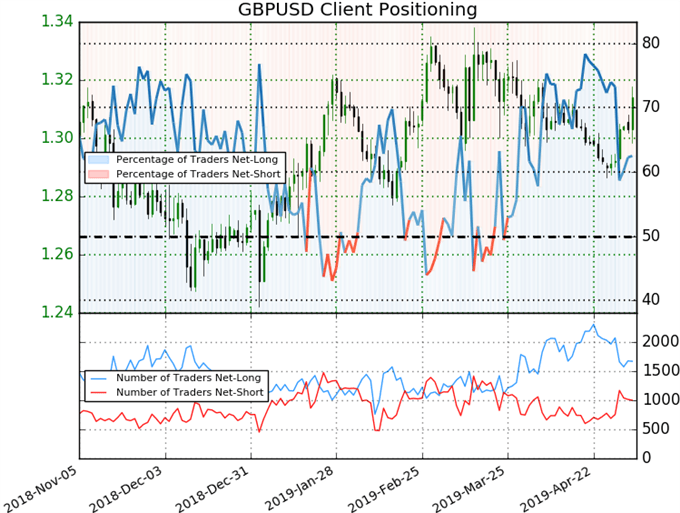
Finally, a look at speculative interest behind the Pound. From the longer duration and larger average exposure futures interest from the CFTC’s commitment of traders (COT) report, we find net speculation is roughly balanced. That said, it has been a far more dramatic unwinding of net short interest than it has been a climb from GBPUSD itself. That could either act as a magnetism for the Cable to target its range high as undecided traders follow ‘the smart money’, or it could set up an accelerated decline should volatility ignite the bears’ interests. Interestingly enough, retail traders who typically attempt to fight prevailing trends like we’ve seen this past week, remain net long despite the stretch. If we do approach 1.3400, that bullish confidence would almost certainly flip as the ‘convenient range boundary’ is in sight.
Chart of Net Speculative Positioning in Pound Futures from CFTC Report (Weekly)
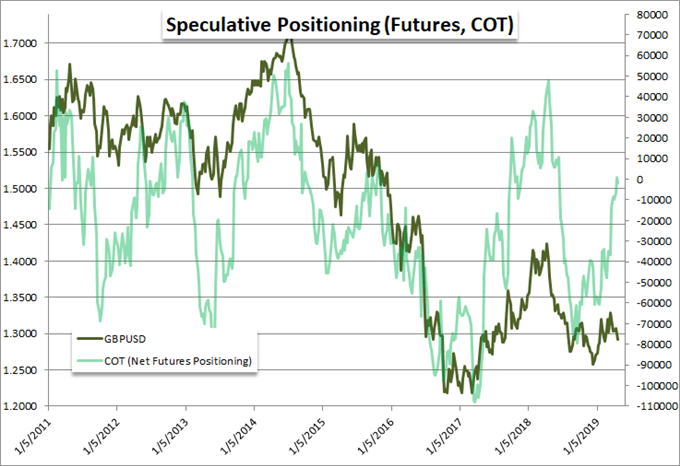
Chart of Retail Trader Positioning from IG Clients (Daily)
Other Weekly Technical Forecast
Australian Dollar (AUD) Outlook: AUDUSD Still Looking Into The Abyss?
Crude Oil Weekly Technical Forecast: Support May Soon Lead to Rally


