


Equities Technical Forecast
- S&P 500, the global benchmark for risk trends, may be topping
- Nikkei 225 is following suit, clearing rising support from January
- DAX 30 is in the process of forming a bearish reversal pattern
See our study on the history of trade wars to learn how it might influence financial markets!
Looking for a fundamental perspective on Equities? C heck out the Equities Fundamental Forecast.
S&P 500 Outlook:Bearish
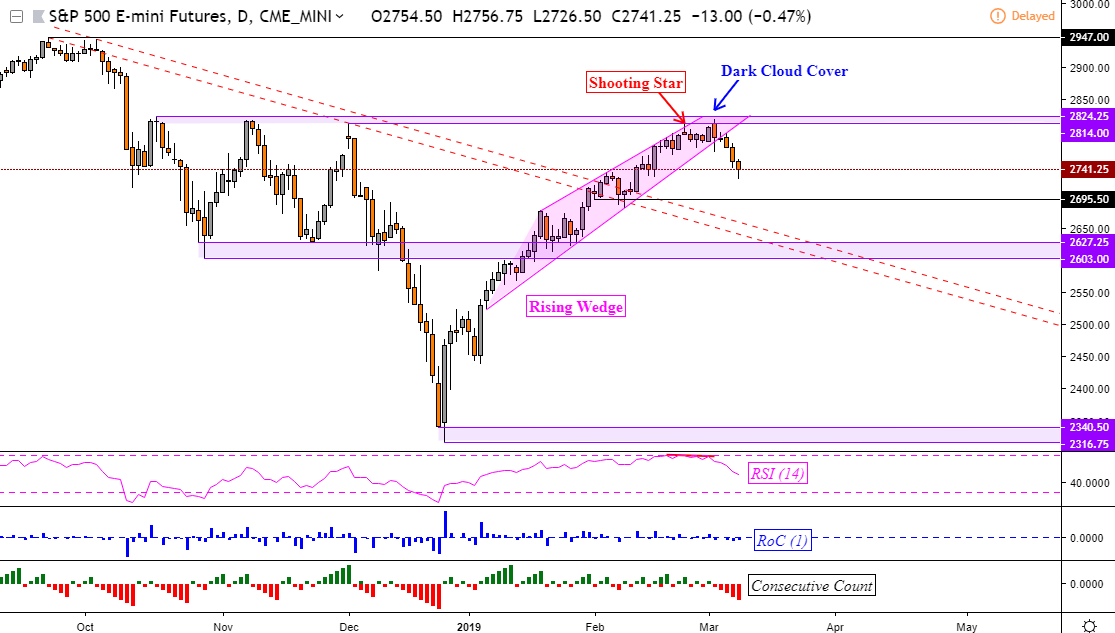
The S&P 500 suffered its worst week since December, falling over 2.3% as fears over slowing global growth increased. Using the futures contract to capture after-hours trading (which I will also be using for the Nikkei 225 and DAX 30 below), the global benchmark for risk trends broke through the floor of a bearish rising wedge candlestick pattern. This followed a failure to push above a range of resistance between 2814 and 2824.
Leading into the drop, warnings such as a dark cloud cover and fading upside momentum hinted that a turn lower was on the horizon. With that in mind, the US index is at risk to extending declines in the week ahead and this could have major implications for sentiment. Near-term support appears to be around 2695, the early February lows. Clearing this exposes a pair of descending parallel resistance lines from October. They may reinstate themselves as new support.
S&P 500 Daily Chart
Nikkei 225Outlook: Bearish
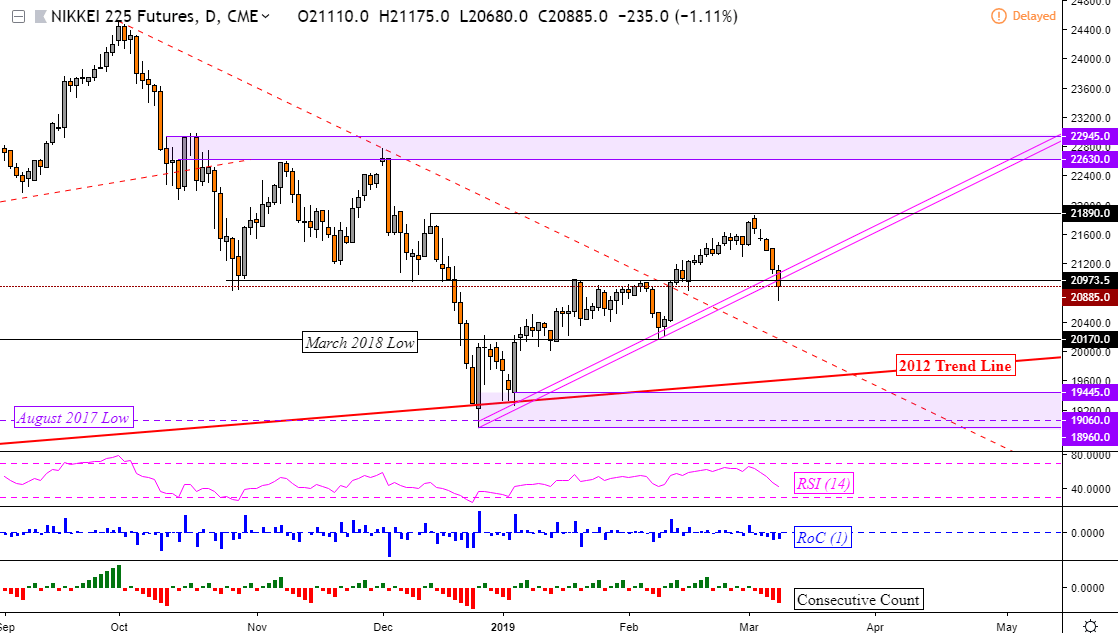
Similar to the S&P 500, the Nikkei 225 had its worst week since December as it fell over 4%. Along the way, the Japanese benchmark stock index cleared parallel rising trend lines from the beginning of this year as well as support around 20973. Confirming another close to the downside opens the door to testing 20170 which is the March 2018 low. This horizontal line also acted as support earlier in February. Otherwise, climbing has resistance eyed at 21890.
Nikkei 225 Daily Chart
DAX 30 Outlook:Bearish
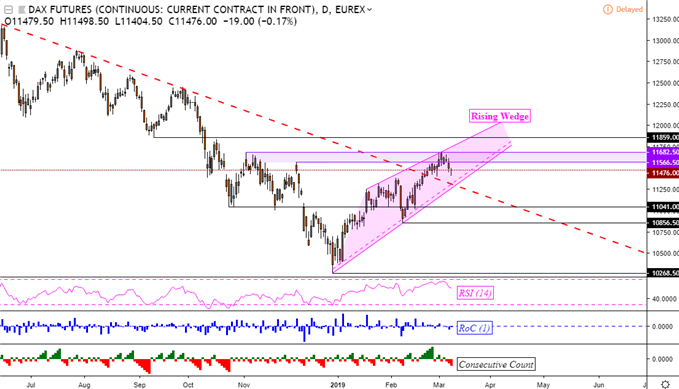
The DAX 30 avoided declines to the extent seen in the S&P 500 and Nikkei 225 thanks to an upside gap at the beginning of last week. Resistance held as a range between 11566 and 11682 before prices turned lower during the past 5 trading days. Germany’s stock index is in the middle of forming a rising wedge bearish reversal pattern, similar to what we have seen in the S&P 500.
Near-term support is the rising support line of the candlestick pattern which is conveniently aligned with the falling trend line from June 2018. Descending through the floor of the formation opens the door to reversing DAX’s uptrend from the beginning of this year. Otherwise, if support holds, we might be due for another retest of resistance at 11682.
DAX 30 Daily Chart
* Charts created in TradingView
FX Trading Resources
- Having trouble with your strategy? Here’s the #1 mistake that traders make
- See how the equities are viewed by the trading community at the DailyFX Sentiment Page
- Just getting started? See our beginners’ guide for FX traders
--- Written by Daniel Dubrovsky, Junior Currency Analyst for DailyFX.com
To contact Daniel, use the comments section below or @ddubrovskyFX on Twitter
Other Weekly Fundamental Forecast:
Australian Dollar Forecast – AUD/USD, AUD/NZD Downtrend May Pause. AUD/JPY Targets New 2019 Low
Oil Forecast – Crude Oil Price Falls From 2019 High On Economy Fears, US Dollar Strength
British Pound Forecast – Charts Keeping Positive Bias
US Dollar Forecast – Dollar Traders On Alert After EURUSD's 1.1200 Slip Pushes DXY to Ceiling
Gold Forecast – Gold Chart Shows Prices Flirting with $1,300 Again After Anti-Risk Bid


