


GOLD TECHNICAL FORECAST – TALKING POINTS
- XAUUSD rebounded over 1 percent Friday to $1,300 after prices based at the $1,285 level earlier in the week
- Gold’s long-term technical uptrend looks set to resume as anti-risk fundamentals helps boost the commodity higher as fears over slowing global growth creep back into the market
- New to trading gold? Download our free Gold Forecast for comprehensive insight from DailyFX analysts!
The price of gold recovered a mere 0.4 percent over the last 5 days of trading following the prior week’s carnage. XAUUSD appears to have found support around $1,285 which lines up with the 0.618 Fibonacci retracement level drawn from the recent high in February and low in November.
SPOT GOLD (XAUUSD) PRICE CHART: DAILY TIME FRAME (NOVEMBER 01, 2018 TO MARCH 08, 2019)

With Friday’s healthy gain, the long-term uptrend in gold could easily continue as prices snap back towards the 20-day moving average. The shift in the RSI and MACD indicators back into sending bullish territory will likely solidify the case for gold’s ascent to resume.
On the contrary, the short-term downtrend could put further pressure on the precious metal, especially if spot prices fail to break back above the psychological $1,300 resistance level as old technical support becomes new resistance. In addition, the 0.786 Fibonacci retracement lines starting from last month’s high down to the August and November lows could serve as additional obstacles for further XAUUSD upside. Alternatively, the area could be viewed as potential upside targets for bulls.
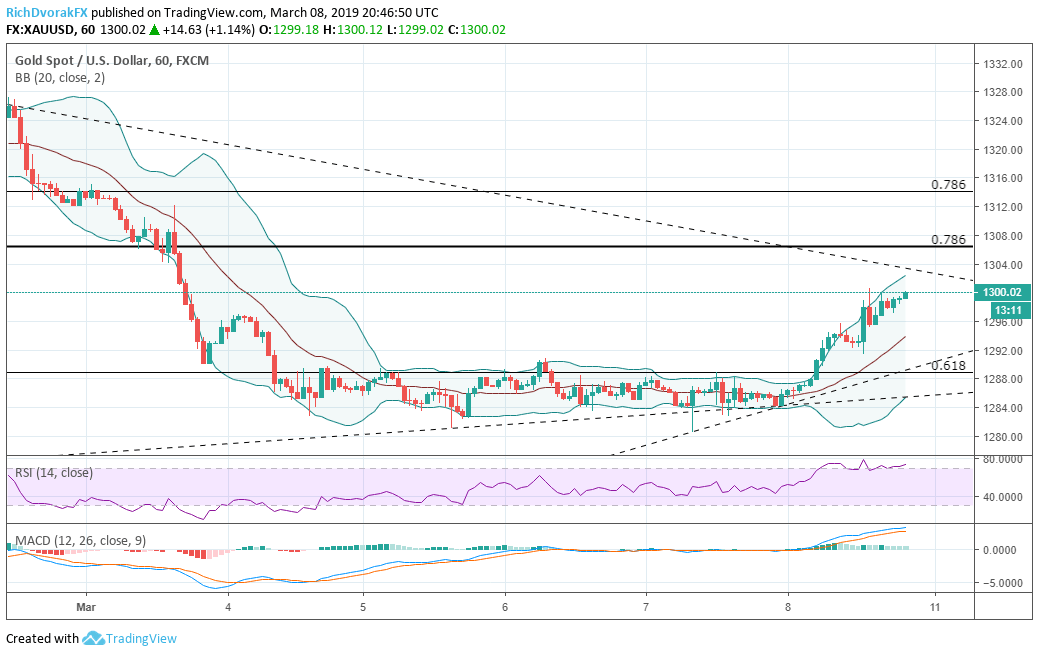
SPOT GOLD (XAUUSD) PRICE CHART: 1-HOUR TIME FRAME (FEBRUARY 28, 2019 TO MARCH 08, 2019)
Looking for a fundamental perspective on Gold? Check out the Weekly Gold Fundamental Forecast.
As gold stabilized at the 0.618 Fibonacci retracement level, prices could begin to wedge if the commodity does not push higher above the newly formed downtrend line. If further upside fails to come to fruition, heavy selling pressure could easily resume.
That being said, fundamental drivers will likely thwart a technical bias and determine where XAUUSD moves from here. The slowing global growth narrative appears to be re-entering the minds of traders and investors which could bid up demand for gold given its anti-risk properties. Although, upside in gold could be materially limited by a strong US Dollar reasserting its dominance.
- Written by Rich Dvorak, Junior Analyst for DailyFX
- Follow on Twitter @RichDvorakFX
Check out our Education Center for more information on Currency Forecasts and Trading Guides.
OTHER WEEKLY TECHNICAL FORECASTS ON OIL, USD, GBP, EUR, JPY, AUD AND NZD:
Australian Dollar Forecast – AUD/USD, AUD/NZD Downtrend May Pause. AUD/JPY Targets New 2019 Low
Oil Forecast – Crude Oil Price Falls From 2019 High On Economy Fears, US Dollar Strength
British Pound Forecast – Charts Keeping Positive Bias
US Dollar Forecast – Dollar Traders On Alert After EURUSD's 1.1200 Slip Pushes DXY to Ceiling
https://twitter.com/RichDvorakFX


