


USD PRICE OUTLOOK: US DOLLAR TRADING RANGES FOR NEXT WEEK AS CURRENCY VOLATILITY SEEPS BACK INTO THE FOREX MARKET
- Currency volatility is showing signs of resuscitating as the US Dollar Index breaks down to its lowest level since July despite the FOMC confirming its shift from dovish to neutral on rates
- USD price action is making a last-ditch effort to cling onto a key technical support level after dropping 3% from its 2019 high as risk appetite roars and the Fed inflates its balance sheet
- A jam-packed economic calendar next week will offer several opportunities to spur US Dollar volatility in addition to the latest US-China trade deal headlines and Brexit developments
The US Dollar has taken a nosedive since the start of December which has pushed the DXY Index to its weakest level since July 01. While USD bulls have clamored that the Federal Reserve’s relatively less- dovish pivot in monetary policy outlook could provide the US Dollar with a positive tailwind, stronger forces appear to be at play that have dragged the Greenback lower.
Two fundamental drivers that could be steering the US Dollar to the downside include the influx of risk appetite – stemming largely from trade deal progress between Washington and Beijing in addition to a clear path to Brexit – and also the Fed pumping billions of Dollars into the system each day.
CURRENCY VOLATILITY ON THE RISE FROM EXTREME LOWS AS USD PRICE ACTION PICKS UP
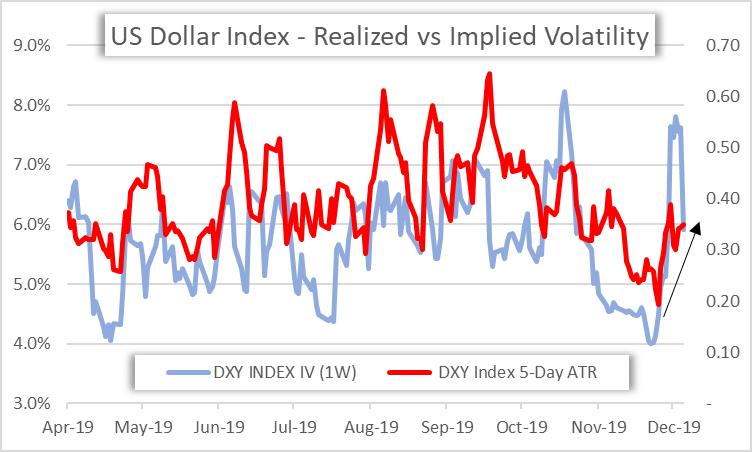
I recently noted how US Dollar volatility appeared amiss and was likely overdue for a rise from extremely low readings. USD price action is now showing signs of turning higher judging by the recent jump in the US Dollar Index’s 5-day average true range.
Rising volatility, if systemic, could provide a positive tailwind to the US Dollar due to its superior liquidity and posturing as a safe haven currency. Though sustained optimism surrounding the US-China trade deal now reached in principle as well as news that Tories won a substantial majority in the UK general election may strongarm the US Dollar lower.
US DOLLAR INDEX PRICE CHART: WEEKLY TIME FRAME (JUNE 2018 TO DECEMBER 2019)

Chart created by @RichDvorakFX with TradingView
The US Dollar is currently gravitating around its 50-week simple moving average and the 23.6% Fibonacci retracement of its February 2018 low, which will look to keep the DXY Index afloat going forward.
Enhance your market knowledge with our free Forecasts & Trading Guides available for download
The rising trendline connecting the January 10, January 31 and June 25 swing lows could also provide a degree of technical support to the Greenback. Nevertheless, both the RSI and MACD illustrate bearish price action gaining pace. Technical resistance highlighted by the 98.00 handle.
US DOLLAR IMPLIED VOLATILITY & TRADING RANGES (1-WEEK)

Take a look at this insight on how to trade the Top 10 Most Volatile Currency Pairs
Once again, GBP/USD is expected to be the most volatile US Dollar currency pair next week with an implied volatility reading of 9.48%. Although, this is lower than its 20-day average of 10.24%. AUD/USD and NZD/USD will likely be on the radar next week with implied volatility readings of 6.79% and 8.16% respectively due to high-impact event risk scheduled over the next 5 trading days.
Keep EUR/USD on the watch list also considering Friday’s threat that the White House is considering slapping a 100% tariff on goods imported from the EU, which risks sparking a new trade war outbreak. On that note, USD/CNH interestingly closed above the important 7.0 barrier even despite President Trump and China confirming a phase one trade deal breakthrough and cancelation of the December 15 tariff tranche.
USD/CNH 1-week implied volatility of 8.17% falls in the top 98th percentile of measurements taken over the last 12-months and is well above its 20-day average reading of 5.61%. Options-implied trading ranges are calculated using 1-standard deviation (i.e. 68% statistical probability price action is contained within the implied trading range over the specified time frame).
-- Written by Rich Dvorak, Junior Analyst for DailyFX.com
Connect with @RichDvorakFX on Twitter for real-time market insight


