


Average True Range (ATR) is a tool used in technical analysis to measure volatility. This indicator does not provide an implication for the direction of price trend. It simply measures the degree of price volatility from high to low for the day.
A simplified explanation of the ATR is that it measures the range of a session in pips and then determines the average of that range over a certain number of sessions. For instance, if using a daily chart with a default setting of 14, the ATR will measure the average daily range, from high to low of the previous 14 days. This way you are getting a current reading on the volatility of a specific currency pair. The idea is that large and increasing values shows ranges that are expanding. As the market normally breathes in and out, this expansion of volatility indicates to us how far prices may reach.
As a result, many traders us ATR as a method to identify and limit risk on trades. For example, if you typically hold trades open for at least a day, you will want to use a stop loss level that is at least 1 Daily ATR value away. That way, as the market goes through its normal breathing, the majority of the movement is likely to be contained within 1 ATR value.
Let’s compare 2 different markets with different ATR values.

(Created by J. Wagner)
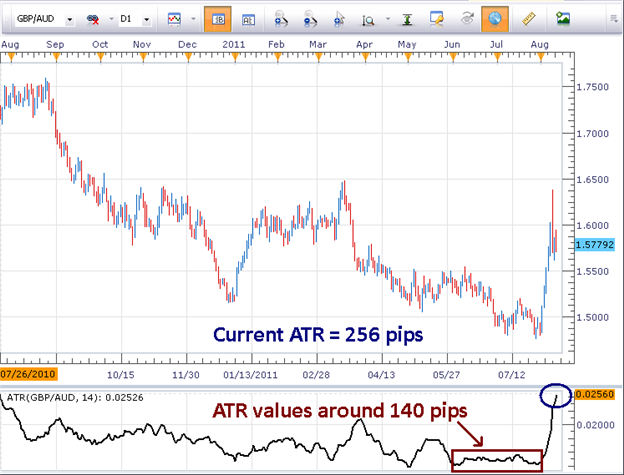
The current 14 day ATR for the EUR/GBP is about 82 pips while the same 14 day ATR for the GBP/AUD is more than three times that amount at about 256 pips. So we can see why a standard 100 pip stop is not the best way to determine your risk on every trade. Many traders will simply use the ATR for their risk. They would place their stop 82 pips from their entry in a EUR/GBP trade or 256 pips from their entry in a GBP/AUD trade. This is one way to base your risk on the reality of the current market you are trading.
Another interesting point on the charts above is where values have generally stood over the recent past. As you can see in the EUR/GBP, it has produced ATR values less than 100 pips for the majority of the previous 12 months.
On the GBP/AUD, at its lowest zone of volatility (red boxed area), it averaged around 140 pips. It is apparent the volatility on the GBP/AUD reaches beyond the current market conditions. It has historically had 2-3 times the size of volatility as the EUR/GBP.
Next: The ADX Indicator Is a Power Tool for Trading Trends (20 of 50)
Previous: How to Trade the Aroon Indicator
Additional educational resources
How Do I Know If a Stop is Too Big
Jeremy Wagner contributes to the Instructor Trading Tips articles.


