


US DOLLAR OUTLOOK: USD PRICE VOLATILITY REMAINS SUPPRESSED DESPITE LATEST FOMC RHETORIC, Q3 GDP DATA DUE
- US Dollar outlook hinges on changes in FOMC rate cut expectations as traders react to the latest US-China trade talk headlines, Fed official commentary and high-impact economic data releases
- USD price action continues to compress, but forex volatility could reignite on the back of a 3Q US GDP report update due Wednesday that will detail US inflation and personal consumption
- Check out IG Client Sentiment for details on retail trader positioning across majorcurrency pairs like EUR/USD, USD/JPY and more
The US Dollar rally was on pause throughout Tuesday’s trading session with the DXY Index maintaining a tight range roughly between 98.20-98.35. Choppiness exhibited in USD price action today can be explained primarily by high-impact economic data releases.
The Advanced Goods Trade Balance reading for October topped estimates and pushed the Greenback higher prior to the New York opening bell, but the US Dollar began to drift lower subsequent to a lackluster US Consumer Confidence report.
Looking to Wednesday, however, US Dollar currency traders will be forced to weather another barrage of updates to closely watched economic indicators according to the DailyFX Economic Calendar. Specifically, a second reading of 3Q US GDP data is set to cross the wires at 13:30 GMT and will be front and center considering it will provide supplementary details on personal consumption.
Moreover, October durable goods orders and weekly initial jobless claims data readings are both due Wednesday at 13:30 GMT as well, whereas the release of Personal Consumption Expenditures (PCE) inflation will follow shortly thereafter at 15:00 GMT.
US DOLLAR INDEX PRICE CHART: DAILY TIME FRAME (MAY 28, 2019 TO NOVEMBER 26, 2019)

Chart created by @RichDvorakFX with TradingView
Tepid consumer confidence data released early Tuesday could strengthen the case for more Fed accommodation ahead – particularly if durable goods or personal consumption components continue to wane. Furthermore, the FOMC could have additional wiggle room to provide more monetary stimulus via interest rate cuts if core PCE – the preferred measure of inflation tracked by the central bank – remains sluggish.
The aforementioned scenarios, if materialized, stand to exert downward pressure on the US Dollar. Looking to a daily US Dollar Index (DXY) chart we find that the 98.20 and 98.45 price levels have potential to serve as respective points of reference for short-term technical support and resistance.
Support is underpinned by the 38.2% Fibonacci retracement of the US Dollar’s trading range since late June while resistance is posed by current month-to-date highs. Positive divergence reflected on the MACD is an encouraging development for USD price bulls, though the RSI is starting to wilt from its previously upward-sloping direction.
CHART OF US GROSS DOMESTIC PRODUCT & PERSONAL CONSUMPTION EXPENDITURE (QUARTERLY)
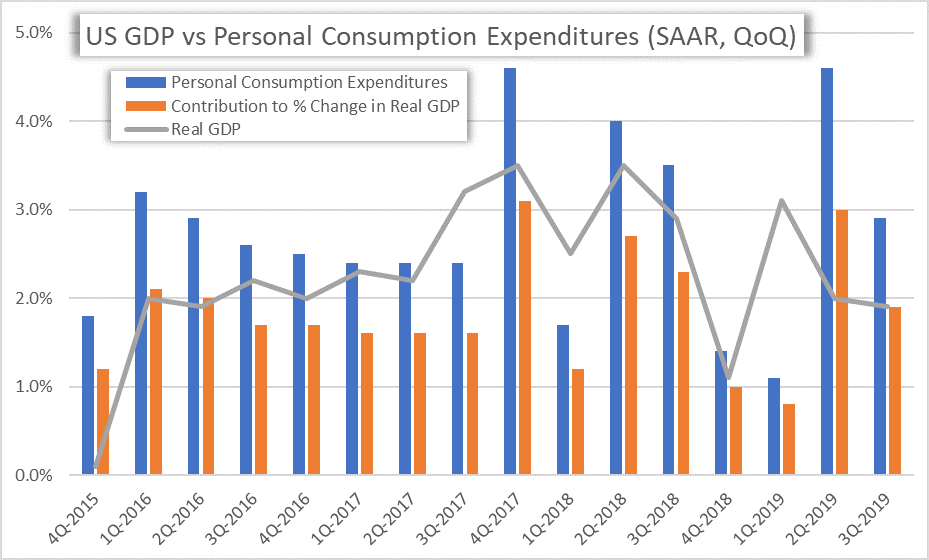
It was previously noted how the US consumer is the crux of the American economy. This is illustrated in the chart above with the quarter-over-quarter change in personal consumption expenditures (PCE) comprising the vast majority of the total contribution to the quarterly percentage change in US real gross domestic product (GDP). Correspondingly, evidence found in Wednesday’s second reading of Q3 US GDP speaking to a skittish consumer with tepid spending patterns could weigh negatively on the broader US Dollar.
CHART OF US CORE PCE INFLATION (QUARTERLY)
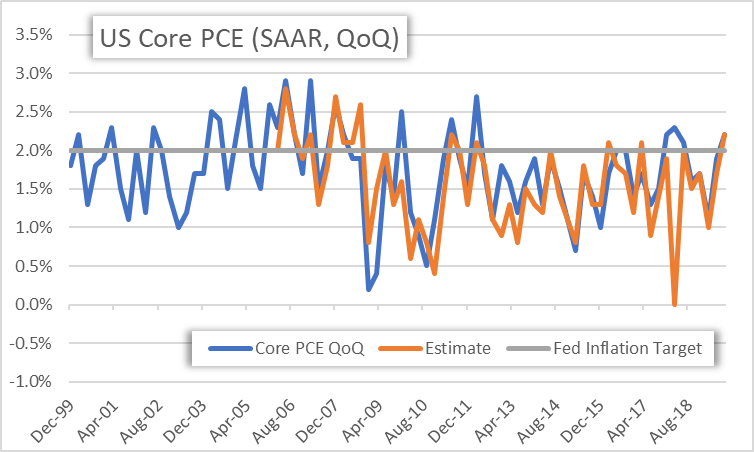
Firming inflation would certainly be a welcomed development for US Dollar bulls. This is seeing that it could deter the FOMC from cutting rates beyond the three consecutive 0.25% cuts at the July, September and October FOMC meetings (deemed a mid-cycle adjustment by Fed Chair Powell).
Yet, inflation measured via core PCE has already jumped above the Fed’s symmetric 2% target with the reading for September clocking in at 2.2% after printing a reading of 1.1% in March and 1.9% in June.
DailyFX Currency Strategist James Stanley previously underscored, however, that the Fed would need to see ‘a really significant rise in inflation’ before even considering hiking interest rates. As such, risk to USD price action appears skewed to the downside.
CHART OF FOMC INTEREST RATE CHANGE EXPECTATIONS (MARCH 2020)

The market’s response to the slew of US economic data releases on deck will be overarchingly reflected in futures-implied probabilities for FOMC interest rate cuts.
Fed Chair Powell and other officials have firmed their language recently to a more neutral tone, which was underscored in the October FOMC meeting minutes.
Since then, the probability that the central bank will cut rates once more by March 2020 has slid from 40.9% to 23.3% as the Fed communicates a less dovish outlook.
US DOLLAR IMPLIED VOLATILITY & TRADING RANGES (OVERNIGHT)

EUR/USD implied volatility remains exceptionally low with the overnight reading at 4.0% ranking in the bottom 20th percentile of measurements taken over the last 12-months. I pointed out in this past Friday’s US Dollar Price Volatility Report how EUR/USD 1-week implied volatility is at a 30-year record low.
That said, USD/JPY could come into forex traders’ crosshairs during Wednesday’s trading session considering that this interest-rate sensitive currency pair (due to its popular use in the forex carry trade) will likely reflect the cleanest response to the high-impact US economic data.
This could particularly be the case if overnight implied volatility of 4.2% is underpriced by forex options traders. Options-implied trading ranges are calculated using 1-standard deviation (i.e. 68% statistical probability price action is contained within the implied trading range over the specified time frame).
-- Written by Rich Dvorak, Junior Analyst for DailyFX.com
Connect with @RichDvorakFX on Twitter for real-time market insight


