


US Dollar, EUR/USD, GBP/USD, USD/CAD Talking Points:
- The US Dollar remains in a near-term range very close to the yearly high.
- Tomorrow brings CPI into the mix and next week brings the FOMC, so there’s some significant drivers on the horizon for the USD.
- As looked at earlier this week, a number of major markets remain near key inflection points.
- The analysis contained in article relies on price action and chart formations. To learn more about price action or chart patterns, check out our DailyFX Education section.

Despite the fireworks in the headlines and across U.S. equity markets, the US Dollar has held a fairly consistent range over the past two weeks. When the Omicron scare began to get priced-in on Black Friday, the USD pulled back as rate hike hopes were seemingly at odds with this new risk factor. Prices held support around a key Fibonacci level, plotted at 95.86.
And then the following week, FOMC Chair Jerome Powell surprised in his congressional testimony with what amounted to admission that inflation was more than transitory. This created a quick spike in the USD but the currency held resistance around another notable level, 96.47 which is a Fibonacci level that functioned as our final target in the Q4 technical forecast on the USD.

Since then, price action has remained range-bound and all of that may change tomorrow with the release of CPI for the month of November.
US Dollar Four-Hour Price Chart
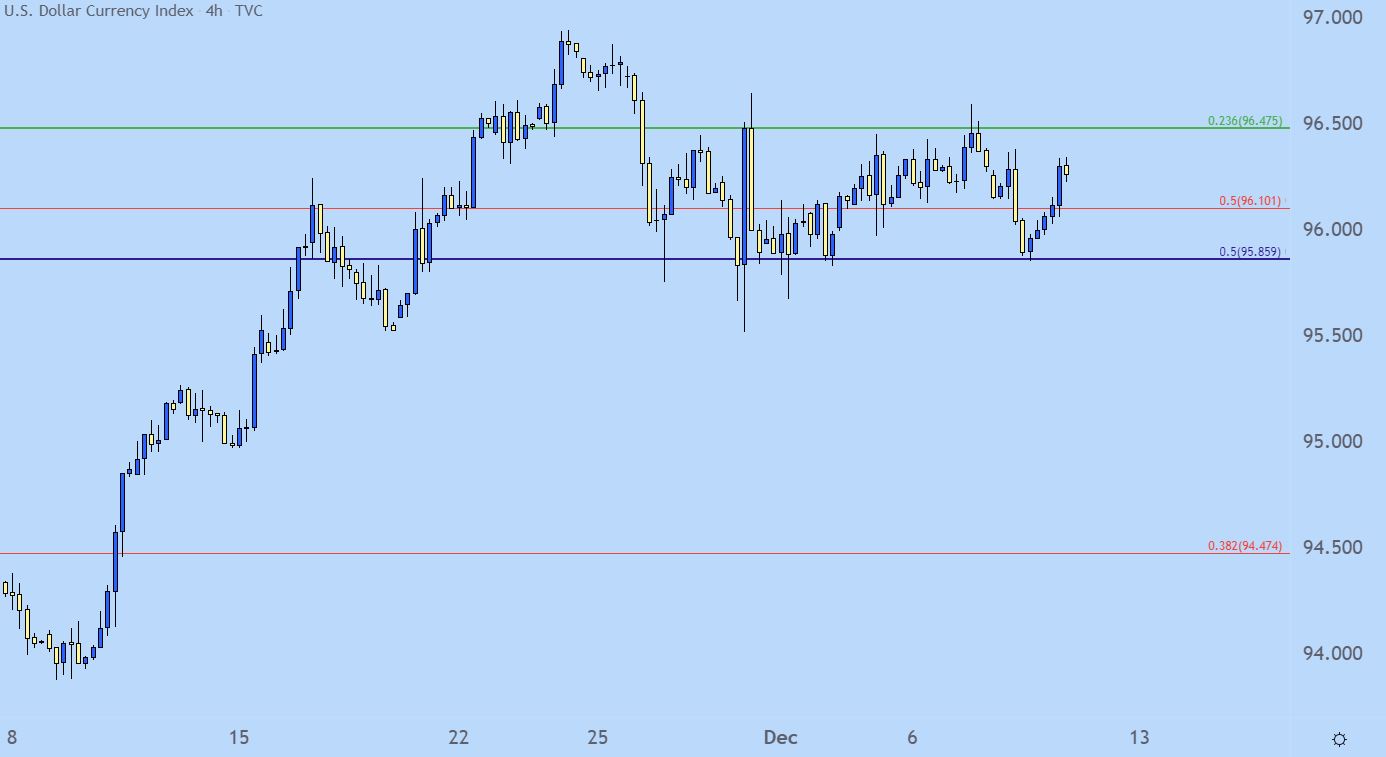
Chart prepared by James Stanley; USD, DXY on Tradingview
CPI to Set the Drive
Last month’s CPI came out at a blistering 6.2%, causing the Fed to re-think the ‘transitory’ narrative that they’d attached to the matter. And to be sure, this has been a building problem that we may not have seen the end of just yet. The expectation for tomorrow is for headline CPI to print at 6.8%, which would be a new 30-year high on that indicator. But, this would also mark the ninth consecutive month in which inflation printed above the 2% marker.
US CPI Since January, 2017
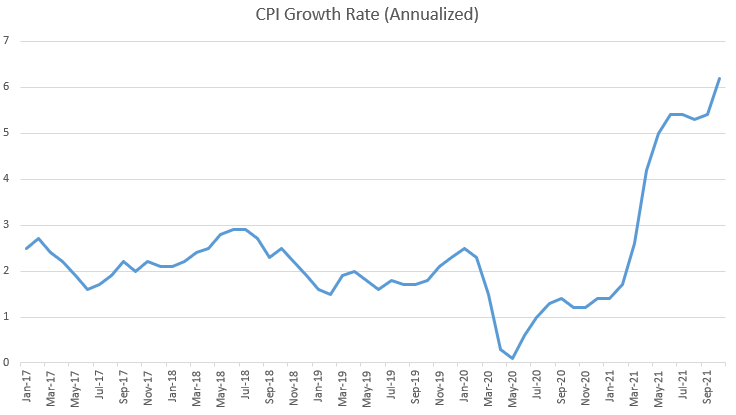
Chart prepared by James Stanley
USD Bigger Picture
I remain bullish on the US Dollar and the fact that prices didn’t pose a greater pullback, in my opinion, denotes just how much potential strength remains. With that said, the move is stretched to a degree and as I discussed earlier this week, a number of major pairs are at significant inflection points. If there is a developing pullback in the USD, there could remain bullish scope provided that prices hold above a support test around prior resistance, taken from around the 94.50 level on the chart.
US Dollar Weekly Price Chart
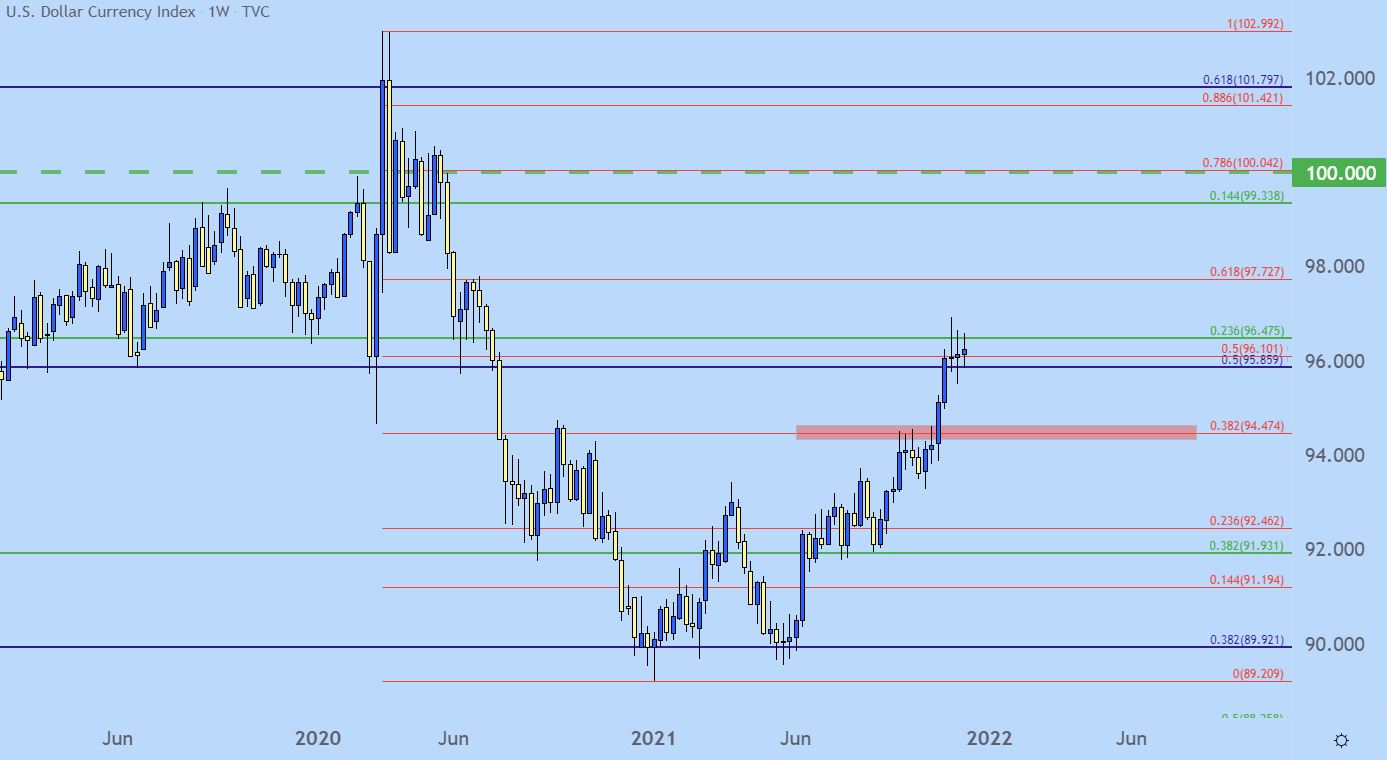
Chart prepared by James Stanley; USD, DXY on Tradingview
EUR/USD: The Anti-Dollar
If the US Dollar is going to go anywhere, it’s going to need at least some participation out of the Euro. The resistance hold in the USD at this key zone correlates with a support zone of similar significance in EUR/USD.
The zone runs between two longer-term Fibonacci levels at 1.1187 and 1.1212. I talked about this zone in late-November and a few weeks later, it’s still holding the lows. But, if the bottom drops out of this, which is very possible given the fundamental divergence between US and European economies and monetary policy, the US Dollar can fly higher. If this doesn’t happen around CPI tomorrow, there’s the FOMC even on the calendar for next Wednesday which would carry similar potential.
EUR/USD Weekly Price Chart
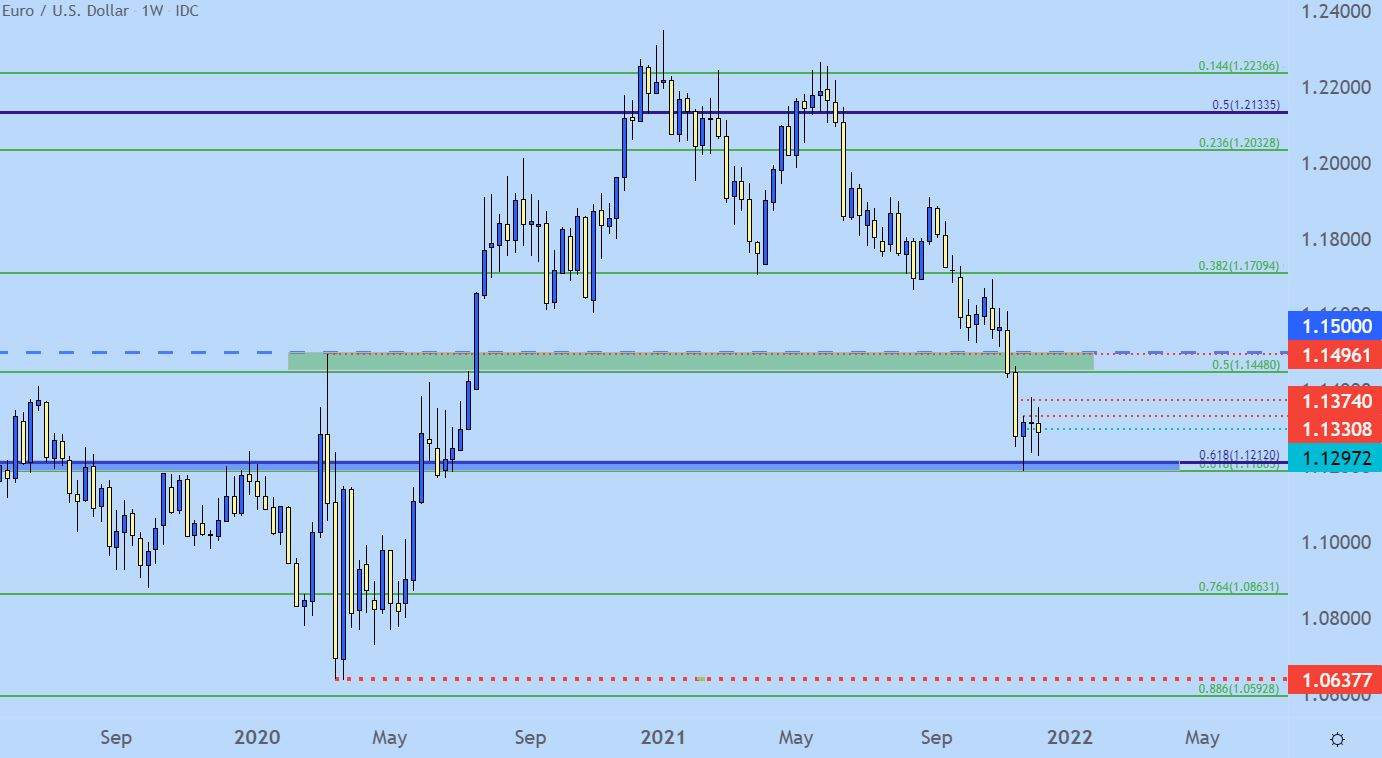
Chart prepared by James Stanley; EURUSD on Tradingview
GBP/USD at a Big Spot
I had published a more in-depth write-up on GBP/USD earlier today, highlighting a significant support zone that continues to hold the lows, with possible invalidation of the bull flag formation.
Similarly, if prices can breach below this support, the tumble could be very fast. But, if CPI comes out inside of the 6.8% expectation, there may be a bit of a relief rally to develop here which would open the door for a lower-high resistance inflection ahead of next week’s FOMC.
GBP/USD Weekly Price Chart
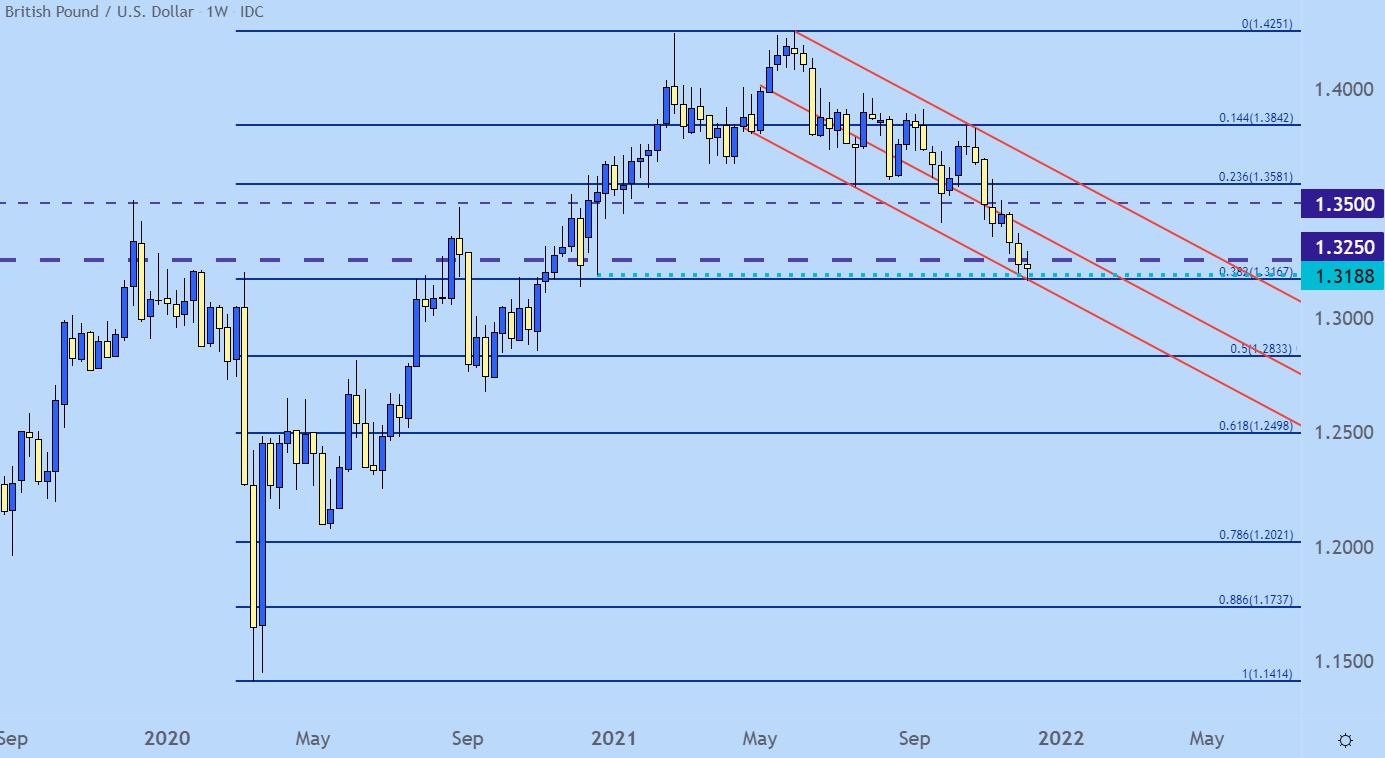
Chart prepared by James Stanley; GBPUSD on Tradingview
USD/CAD
There’s been some interesting dynamics in USD/CAD this week. As looked at on Tuesday, the pair had a fairly significant short-term pullback after grinding at a resistance level around 1.2850 last week. That led to a 38.2% pullback of the recent move, which showed up in the middle of a key support zone taken from longer-term charts.
Yesterday’s BoC has since produced a net negative reaction in CAD, allowing for USD/CAD to lift off of that support. If USD strength comes back tomorrow, that 1.2850 resistance spot is vulnerable to a breakout, and that would open the door for a move up to prior swings around 1.2900 and 1.2942, after which the 1.3000 big figure would come into the equation for the first time in 2021.
USD/CAD Daily Price Chart
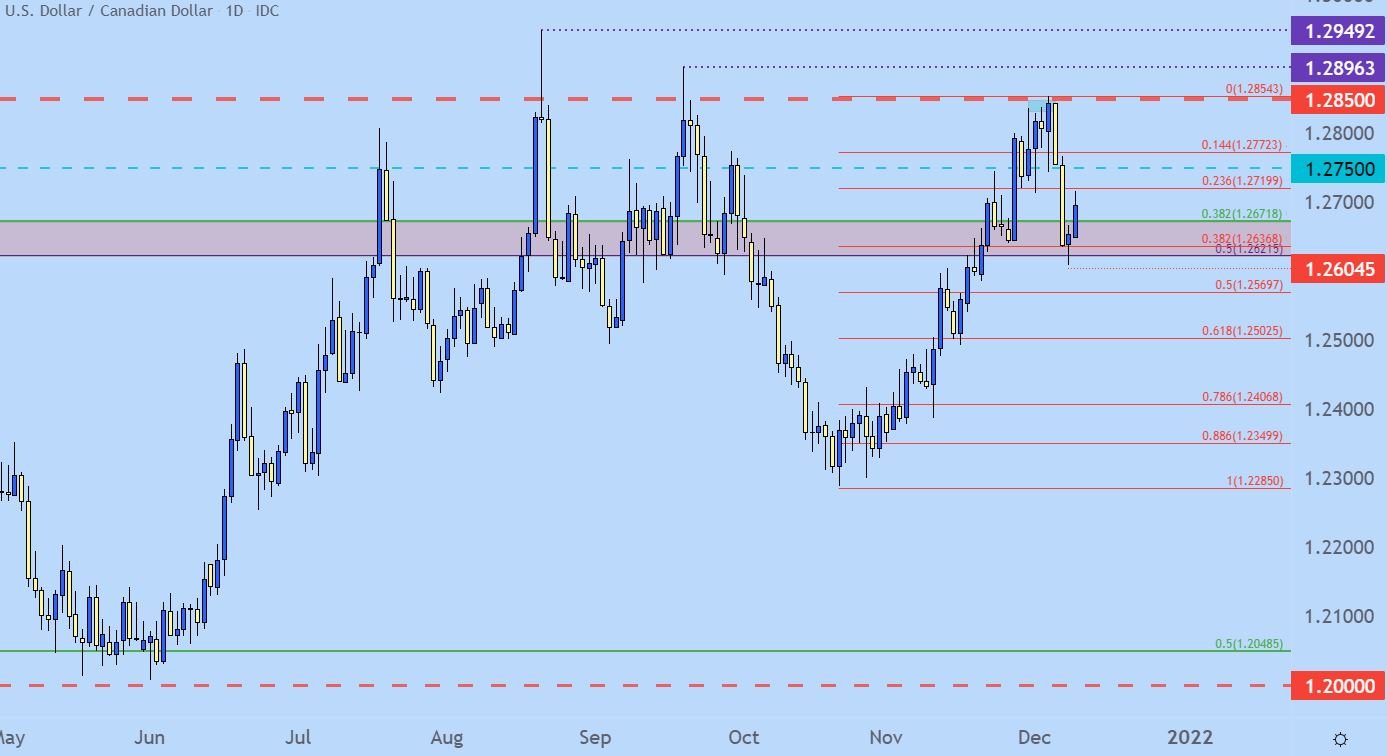
Chart prepared by James Stanley; USDCAD on Tradingview
--- Written by James Stanley, Senior Strategist for DailyFX.com
Contact and follow James on Twitter: @JStanleyFX


