USD, S&P 500 Talking Points
- The Omicron variant has now been identified in the U.S., and this created a quick reaction in markets.
- This is likely to change little around the Fed and, if anything, may ease the pressure they’ve faced of recent regarding inflation. It seems unlikely that the bank would abandon the brute force support to markets that’s been commonplace since Covid first came into the equation.
- The analysis contained in article relies on price action and chart formations. To learn more about price action or chart patterns, check out our DailyFX Education section.


It’s just been reported that the first case of the Omicron Covid variant has been found in the California. This would mark the first such case in the U.S. since news of the variant began to spread last week.
That initial headline evoked a strong response from markets, at least initially, but calm showed around this week’s open as many risk markets began to show a greater sense of stability.
But, now that the variant has been confirmed in the United States, the bigger question is ‘what’s next?’
What is Omicron?
It’s a heavily mutated Covid variant that, as of now, carries a litany of unknown consequences. One of the few things that is known at this point is that it’s more transmissible. But, the more important questions of whether current vaccine protocol is effective or whether this variant amounts to more hospitalizations or more cases of ‘Long Covid’ that remain to be seen and likely we won’t have much data on that for another couple of weeks.
Outside of waiting for more consistent data, markets have been running on anecdotes, such as the Moderna CEO Stephane Bancel saying that existing vaccines may not be as effective against the variant. But, on the other side, just a day earlier, the Pfizer CEO Albert Bourla had said that the Covid pill that his company is working on would be effective against the variant. So there’s just a ton of unknown out there at this point and, in general, markets abhor uncertainty, which explains last week’s Black Friday drop.
What Markets to Follow and What to Look for?
Given that we’ve already had an episode of this getting ‘priced-in,’ there are a number of possible scenarios that have already popped up.
In the immediate aftermath of this news, Gold prices popped higher, the US Dollar dropped and stocks started to sell-off. That sell-off on Friday was especially brutal with equities closing near their lows – but this was a holiday-thin liquidity environment that I had warned of ahead of the holiday.
I had even said on the Monday before the holiday ‘those low liquidity conditions can be like kindling for a fire, and when provided proper spark can lead to really outsized moves.’
This may help to explain the aggressive reactions that were seen on the day after Thanksgiving, when many desks are short-staffed.
The US Dollar
The move in the USD was somewhat telling, in my opinion, because if we are seeing a legitimate constraint to the recovery, whether that be in Europe or Asia, this could hit overall global growth which could disrupt the Fed’s rate hike plans. Of course, this would need to hit inflation as well, especially after Powell’s proclamation yesterday on the topic, but again, if we’re seeing a legitimate business slowdown from this new variant, there could be a case to be made for lower rate hike expectations which could amount to a weaker USD. This may be a temporary move, of course, as rate expectations are a common driver of currency prices and there’s not many scenarios at this point that would see the Fed recede behind the ECB or the BoJ as far as rate policy is concerned.
For that outcome, we’re likely looking at close to a worst-case scenario, in which the variant is more transmissible, more dangerous and evades current vaccine protocols. That scenario could compel lockdown-like measures but given the almost two year struggle with the virus, there may not be much tolerance for such heavy-handed action, and that creates even more uncertainty which, again, is what markets really abhor.
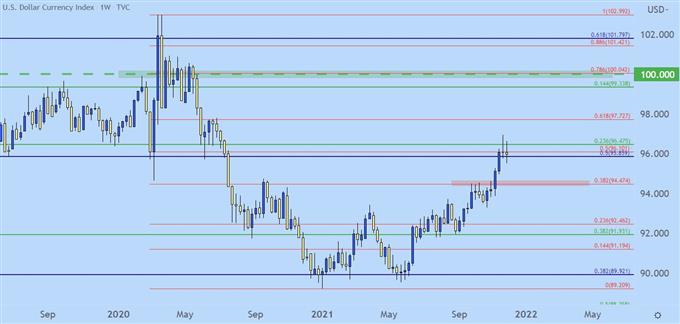
In the USD, this uncertainty, at least near-term, may produce a pullback towards the 94.47 level that I talked about in the webinar earlier today. And from a longer-term perspective, this would be normal withing the bigger-picture trend continuation showing in the US Dollar.
At this point, the USD is perched at a key spot of higher-low support, taken from a series of Fibonacci levels that have so far stalled the USD breakout.
US Dollar Weekly Price Chart

Chart prepared by James Stanley; USD, DXY on Tradingview
S&P 500
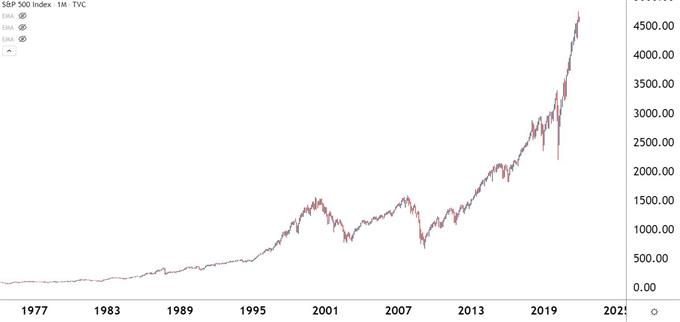
When looking at this matter through stocks, I think the important thing to do is to consider the long-term. So, I’ll start by sharing a monthly chart of the S&P 500, which is practically parabolic.
S&P 500 Monthly Price Chart

Chart prepared by James Stanley; S&P 500 on Tradingview
Over the past 45 years there’ve only been a couple of noticeably bearish periods in the market. The tech bust in 2000 and the Financial Collapse in 2008 certainly stand out. But something happened after that that’s really created the strength in the move and that’s been QE and a very active Federal Reserve.
With that in-play, there’s been one major deviation, and that was last March when Covid was getting priced-in. That was a brute incursion of uncertainty, but stocks were weak for about a month before support finally set-in.
And that led into one of the strongest bull markets in history – even as a pandemic raged in the background. Powell had a key line shortly after that March spill that I think is noteworthy even today. On the television program 60 Minutes in May, Powell said that there was ‘no limit’ to what the bank could do with the liquidity programs available to them.
When you can print your own currency (the Treasury department, technically), there’s not as much worry about a run on bank assets. So, if the situation gets rocky enough, this is just another excuse to fire up the printing press again.
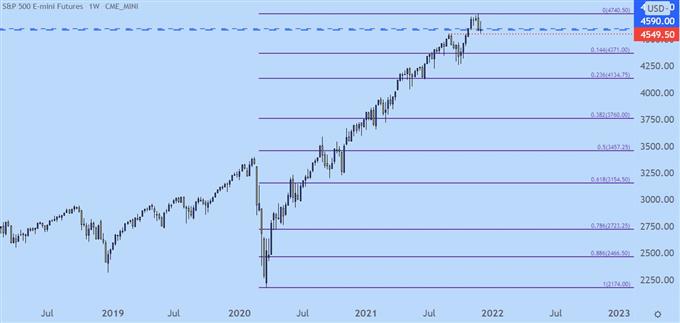
This may create a pullback, however, and for a stock market that hasn’t really stopped going up for 20 months that can actually be a ‘good’ thing in a healthy bullish trend with a longer-term scope. A 38.2% Fibonacci retracement from the high set in November would be a 20.8% move, which would technically make for a ‘bear market.’ But, if cash is cheap in that scenario it’s difficult to imagine market participants not jumping on perceived bargains in favorites like Apple or Amazon.
S&P 500 Weekly Price Chart

Chart prepared by James Stanley; S&P 500 on Tradingview
Gold
Gold could prosper in a worst case scenario, which would likely entail a plethora of additional FOMC accommodation. Given the already high levels of inflation, significantly more accommodation would drive even higher levels of expected inflation and given a low rates picture, this could be the pop that Gold bulls would be looking for.
This would be a longer-term theme, however, as the initial ‘shock’ factor could drive Gold prices lower, similar to what was seen in February of 2020 or even during the Financial Collapse, from March to October of 2008.
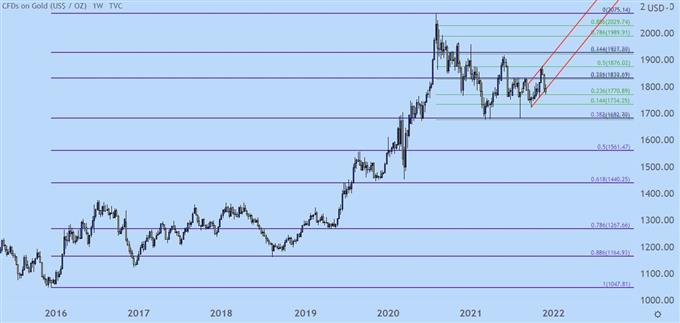
While Gold remains bearish at the moment, as I discussed earlier, with a near-term bear flag in-play, the longer-term chart does retain some bullish potential, largely taken from the fact that the 38.2% Fibonacci retracement of the 2015-2020 major move has held support three times throughout this year. That can keep the door open for topside potential.
Gold Weekly Price Chart

Chart prepared by James Stanley; Gold on Tradingview
--- Written by James Stanley, Senior Strategist for DailyFX.com
Contact and follow James on Twitter: @JStanleyFX


