


USD, EUR/USD, Gold, Oil Talking Points:
- This webinar looked at macro markets of USD, EUR/USD, Gold and Oil in the effort of finding workable levels in order to devise strategy.
- I had shared many of my personal analysis concepts during this session, each of which are linked throughout this article.
- The analysis contained in article relies on price action and chart formations. To learn more about price action or chart patterns, check out our DailyFX Education section.

This is an archived webinar from earlier today in which I showed how I’m locating current levels of interest in the markets of the US Dollar, EUR/USD, Gold and Oil.
There are quite a few concepts at work here but as I shared throughout the webinar, the goal really was simplicity, using Fibonacci to identify possible inflection points, and then waiting for price action to show potential around that price.
This approach utilizes a heavy incorporation of multiple time frame analysis with many of the Fibonacci retracements shown drawn on the monthly or weekly charts with applicability on daily or hourly charts.
The first market that I looked at was the US Dollar, which has seen the bullish trend run into a confluent spot of Fibonacci levels. As I had shared, this doesn’t necessarily mean ‘trend-killer,’ but it could be a convenient spot for the market to put in a pause point.
The key for this weekly bar is to see whether it closes as an evening star pattern, which would confirm that pullback potential. Support potential shows at prior resistance levels, taken from around the same Fibonacci retracement levels, such as the 94.47 spot on the chart.
US Dollar Weekly Price Chart
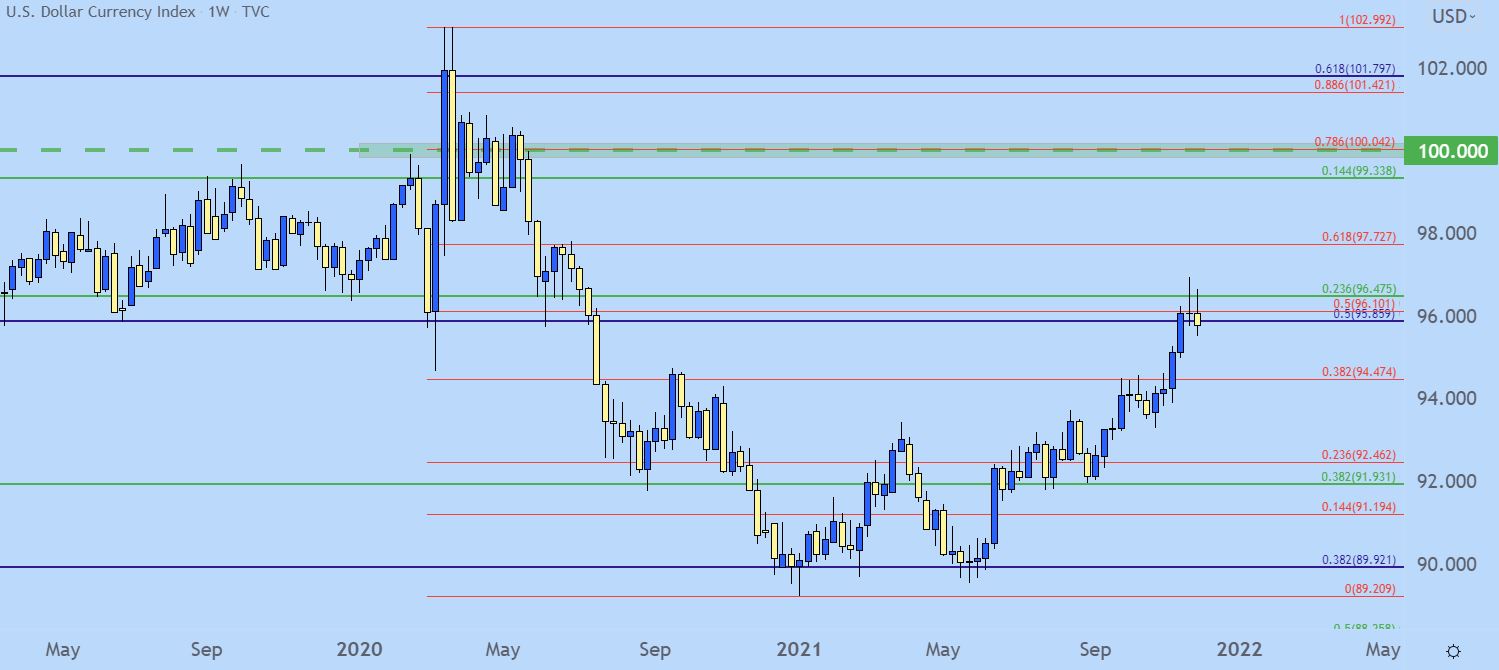
Chart prepared by James Stanley; USD, DXY on Tradingview
EUR/USD Bounce from Fibo Support
The next market that I looked at was related to the USD, as the Euro plays a gigantic role in the composition of the DXY index. I’ve said this numerous times over the past few months but it’s difficult for the US Dollar to move in any direction without at least some participation from the Euro.
The recent bullish breakout in the USD was no different, as a plummeting Euro helped to drive those capital flows back towards the US. But – the matter had become very oversold last week, right around the time that a big spot of longer-term, confluent support came into play.
The price of 1.1212 is the 61.8% Fibonacci retracement of the ‘lifetime move’ in the pair. And at 1.1187, we have the 61.8% retracement of the 2017-2018 major move. Collectively, this confluent zone has so far stalled the sell-off, and this carries potential for a deeper pullback, towards another Fibonacci level of note around 1.1448, which can be spanned up to the 1.1500 psychological level to create a possible resistance zone.
EUR/USD Weekly Price Chart
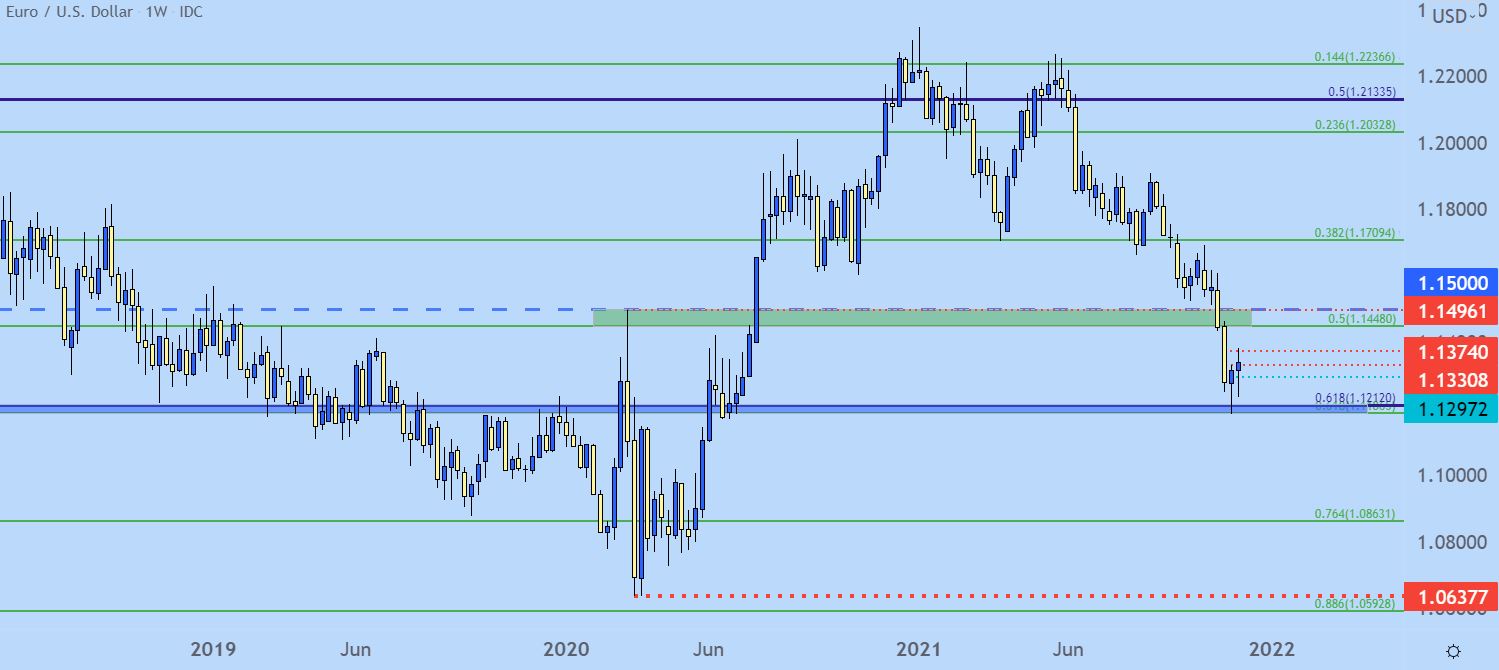
Chart prepared by James Stanley; EURUSD on Tradingview
Gold
During the webinar I went into quite a bit of background around Gold markets and how they’ve responded to inflation in the past, using the example from the 70’s to highlight reactions around negative real rates. I also drew up a few different Fibonacci retracement to help define lines-in-the-sand while showing off a very recent bear flag formation.
This keeps the door open for lower prices, with short-term resistance potential around 1808 and 1815. The big level below on Gold is around 1680, which syncs up with the 38.2% retracement of the 2015-2020 major move. A breach below that spot, which has already been tested thrice in 2021, opens the door for a run down towards 1560 or possibly even lower.
Gold Daily Price Chart

Chart prepared by James Stanley; Gold on Tradingview
Oil
Towards the end of the webinar, there was a question about how these levels might interact with fundamental headwinds, similar to what we’re seeing in oil at the moment. Similar to the above three markets, oil prices are working well within the confines of recent support and resistance analysis, and I’ve followed this on DailyFX through my written articles throughout this year.
Back in May, crude oil was gearing up for a test at a really big resistance zone . I wrote up an Analyst Pick to look at the setup’s potential.
That led to a strong topside run that eventually pushed up to the 82.60 level, where there resides a key Fibonacci level of note, as I had shared in the webinar. This level had stalled the move until last week’s headlines really began to hit crude prices, and accordingly price action fell down to another zone of confluent Fibonacci levels that had previously functioned as resistance (for the breakout I talked about in May).
Crude Oil Monthly Price Chart (CL2)
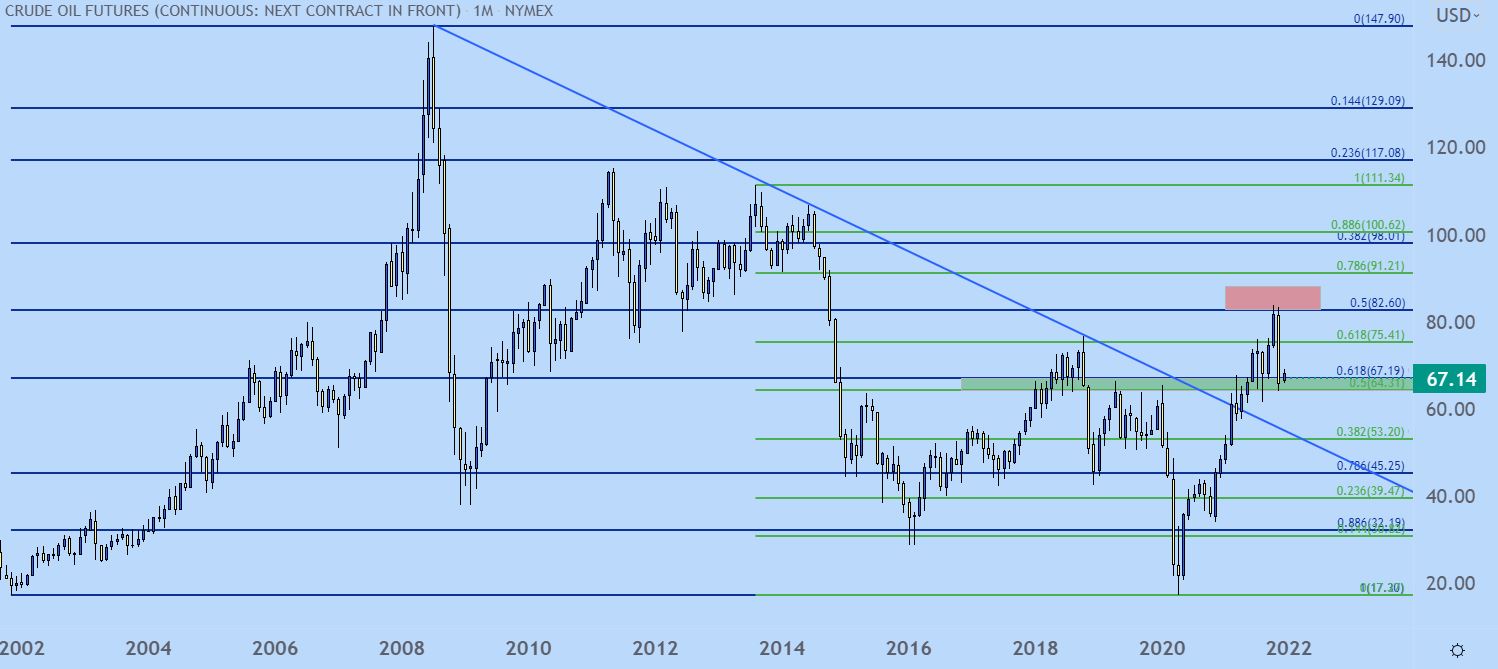
Chart prepared by James Stanley; CL2 on Tradingview
--- Written by James Stanley, Senior Strategist for DailyFX.com
Contact and follow James on Twitter: @JStanleyFX


