


WTI Crude Oil Talking Points:
- Oil prices are testing a key zone of long-term resistance.
- Oil bulls have been badgering this spot on the chart for almost three full months now. Can they finally break through?
- The analysis contained in article relies on price action and chart formations. To learn more about price action or chart patterns, check out our DailyFX Education section.
Crude oil prices continue to show breakout potential as price action is testing a huge zone of resistance on the chart. This same zone of resistance has caught the highs for 2019, 2020 and of course, 2021; at least so far. The most recent iteration, however, has some appeal as the initial reversal off of this zone soon found support on a trendline projection.
Bulls reacted and quickly pushed price action right back into this zone between two Fibonacci values of 64.31 and 67.19. And while they’ve been yet unable to break through, the continued persistence that they’ve shown highlights that this fight isn’t yet over, and that topside breakout may soon be on the horizon.
To learn more about Fibonacci, check out DailyFX Education
WTI Crude Oil (CL2) Weekly Price Chart
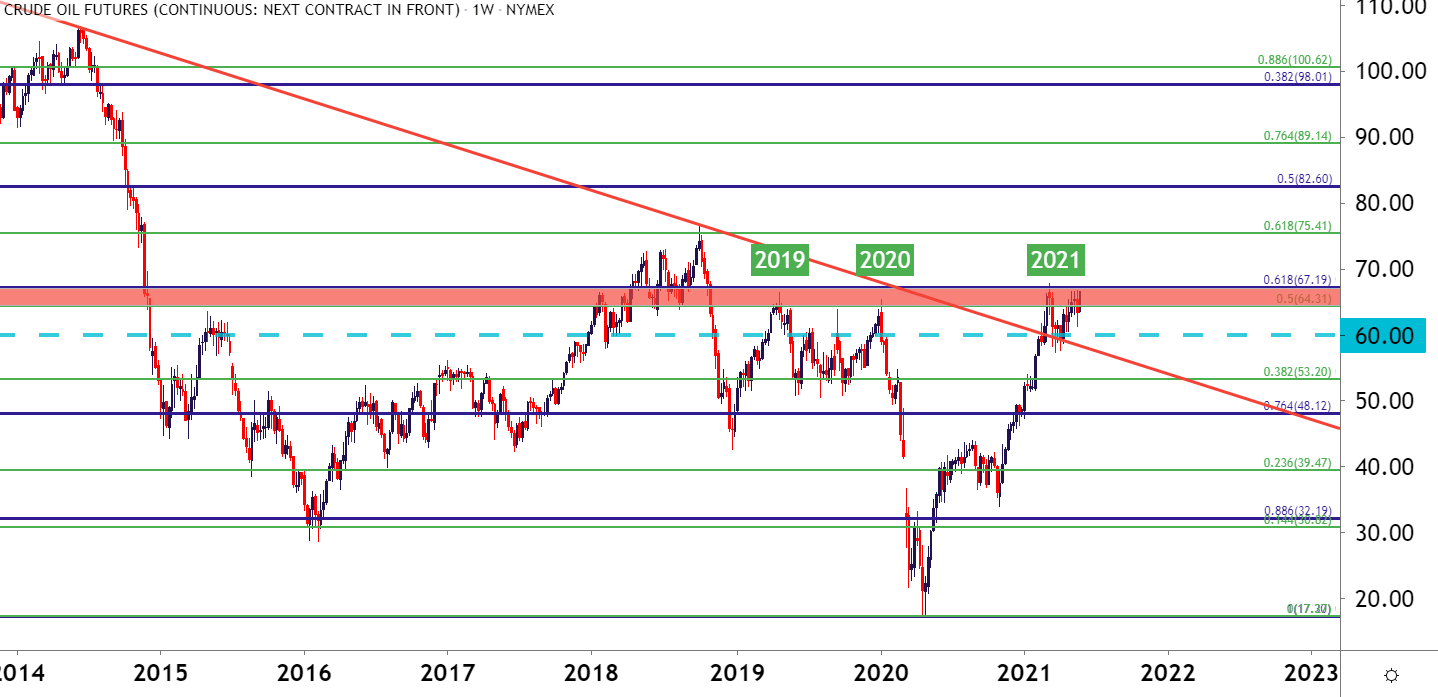
Chart prepared by James Stanley; CL2 on Tradingview
I’m going to look at a longer-term chart next because that’s what I think makes this breakout potential a bit more compelling.
From the monthly chart, we can see that trendline that came into play recently as support. This trendline can be found by connecting 2008 and 2014 swing highs, with the 2018 high coming in as a third point of touch to confirm the trendline.
More recently, this trendline started to come into play in February before bulls were able to elicit a breakout on their way to the confluent zone that’s currently in-play. But – this highlights the potential for a longer-term trend as that trendline that was in-play for more than a decade has now been taken-out.
WTI Crude Oil (CL2) Monthly Price Chart
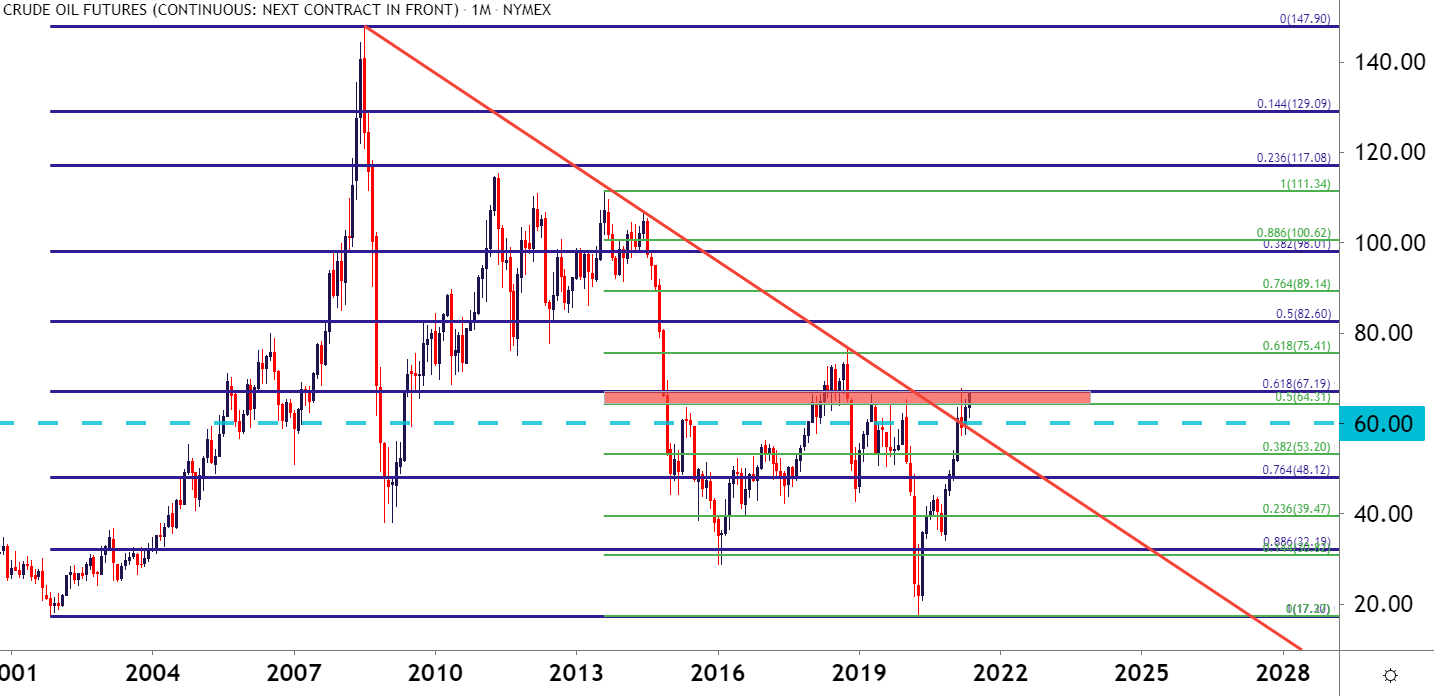
Chart prepared by James Stanley; CL2 on Tradingview
WTI Crude Oil: Plotting the Break
At this point there’s been considerable posturing inside of the 67.00 handle. A bit higher, at 67.19, is the 61.8% Fibonacci retracement of the 2001-2008 major move. And a little higher than that, we have the recent swing-high at 67.79 which currently constitutes the three-year-high in oil prices.
This can be a troubling area prone to false breakouts or possible reversals. Attempting to avoid such can lead to a couple of different options: Either give the breakout entry a bit of room on the upside in the effort of avoiding getting wicked-in to a setup or, alternatively, plotting for a pullback, similar to what showed last week when bulls were unable to break through. This can highlight short-term support potential at the bottom of that resistance zone, around 64.31 or, perhaps a bit deeper, around last week’s low, taken from around 61.36.
WTI Crude Oil (CL2) Daily Price Chart

Chart prepared by James Stanley; CL2 on Tradingview
--- Written by James Stanley, Strategist for DailyFX.com
Contact and follow James on Twitter: @JStanleyFX


