


US Dollar, EUR/USD, GBP/USD, USD/CAD Talking Points:
- Tomorrow brings Non-farm Payrolls out of the U.S., and given this week’s pivot from FOMC Chair Jerome Powell, this data print carries some implications for near-term monetary policy.
- Powell sounded much more hawkish towards inflation this week: Perhaps in an effort to afford greater flexibility if/when he takes a dovish twist in response to Omicron. Or, maybe it’s due to his recent re-nomination and the security he now has in the position to speak more frankly on the matter.
- The analysis contained in article relies on price action and chart formations. To learn more about price action or chart patterns, check out our DailyFX Education section.

Tomorrow brings Non-farm Payrolls out of the United States and this should get considerable focus from global markets as it’ll be the last such report ahead of the December rate decision at the FOMC.
And this week, the stakes were raised, as Chair Powell moved to retire the word ‘transitory.’ The signaling here is huge, as the bank has continued to dismiss the above-target inflation prints throughout this year as something due to supply chain issues, allowing them to stay heavy-handed with stimulus and low rates. But, as they move away from that thesis and after Yellen’s warning two weeks ago, that the bank needs to move to ensure that inflation does not become ‘endemic,’ there’s now the fear that the FOMC may be nearing a hawkish pivot in their strategy.
The December NFP report is a big piece of data to digest ahead of the December rate decision, where the FOMC will trot out updated forecasts and projections that inform of their tentative plans for 2022 and beyond.
The US Dollar remains pegged near yearly highs, with short-term support coming from an area of long-term interest. The 50% marker derived from the Fibonacci retracement taken from the 2001-2008 major move plots at 95.86, which has helped to carve-out today’s low.
US Dollar Monthly Price Chart

Chart prepared by James Stanley; USD, DXY on Tradingview
USD Shorter-Term
On a shorter-term basis, we can see a quick jolt of strength from that Tuesday comment from Chair Powell. Since then, price action has digested with support showing around that long-term level. This keeps the door open for strength ahead of tomorrow’s NFP report.
US Dollar Four-Hour Price Chart

Chart prepared by James Stanley; USD, DXY on Tradingview
EUR/USD
EUR/USD could be exposed to further losses, particularly if we get a strong NFP report tomorrow. The European currency pulled back last week on news of the Omicron variant, but that seemed to be more of a USD-move with rate hike bets leaving the market.
But EUR/USD found resistance at the same 1.1374 level that had previously held the highs, and this held even through a stronger-than-expected inflation report out of Europe on Tuesday.
There’s a really big zone of long-term support in play at the 1.1187-1.1212 level on the chart. I had discussed that last week and again this week after it came into play. Bearish short-term strategies can look for price action to revert to this zone.
EUR/USD Four-Hour Price Chart
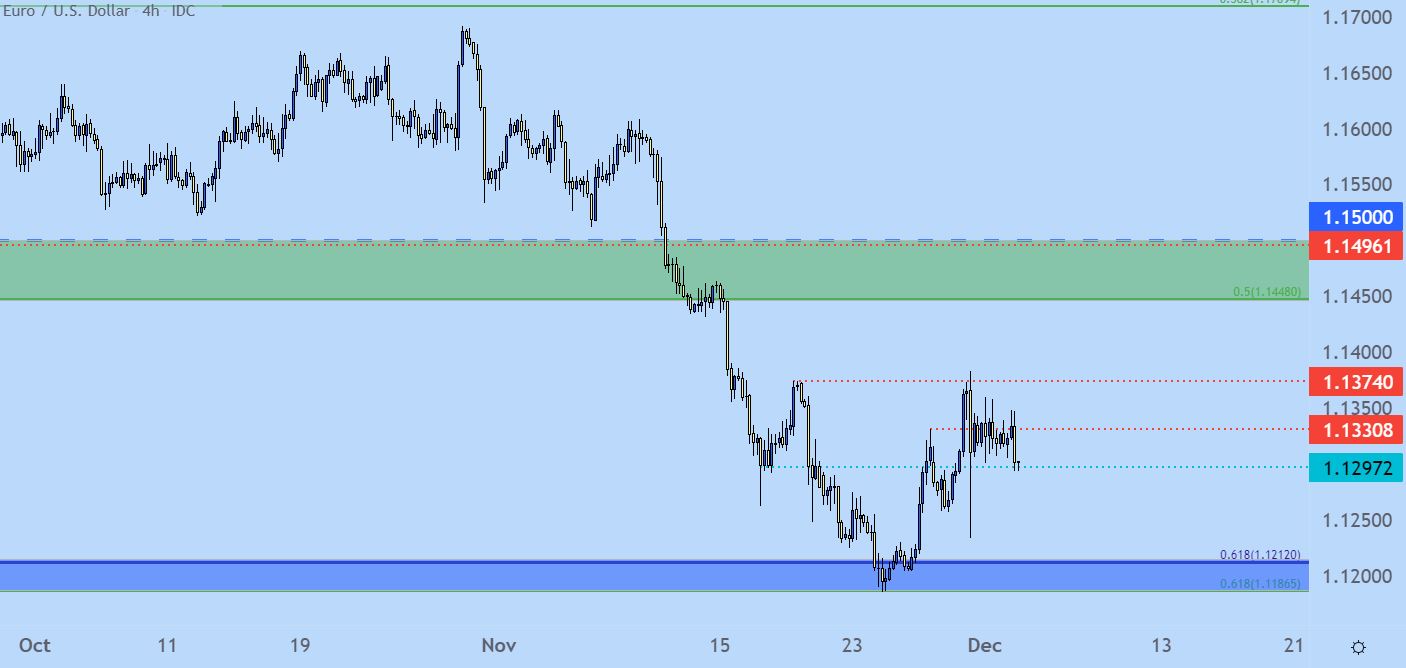
Chart prepared by James Stanley; EURUSD on Tradingview
GBP/USD
GBP/USD started the week with a spill down to a fresh 2021 low, which came very close to the swing from late-December 2020 at 1.3188.
Support showed from the lower trendline in a bull flag formation. And despite the bounce that followed, sellers have remained very active, with a number of upper wicks showing on candles from this week. This highlights the potential for further bearish price action in the pair, with the 1.3362 level providing some element of invalidation to the near-term bearish trend.
GBP/USD Daily Price Chart
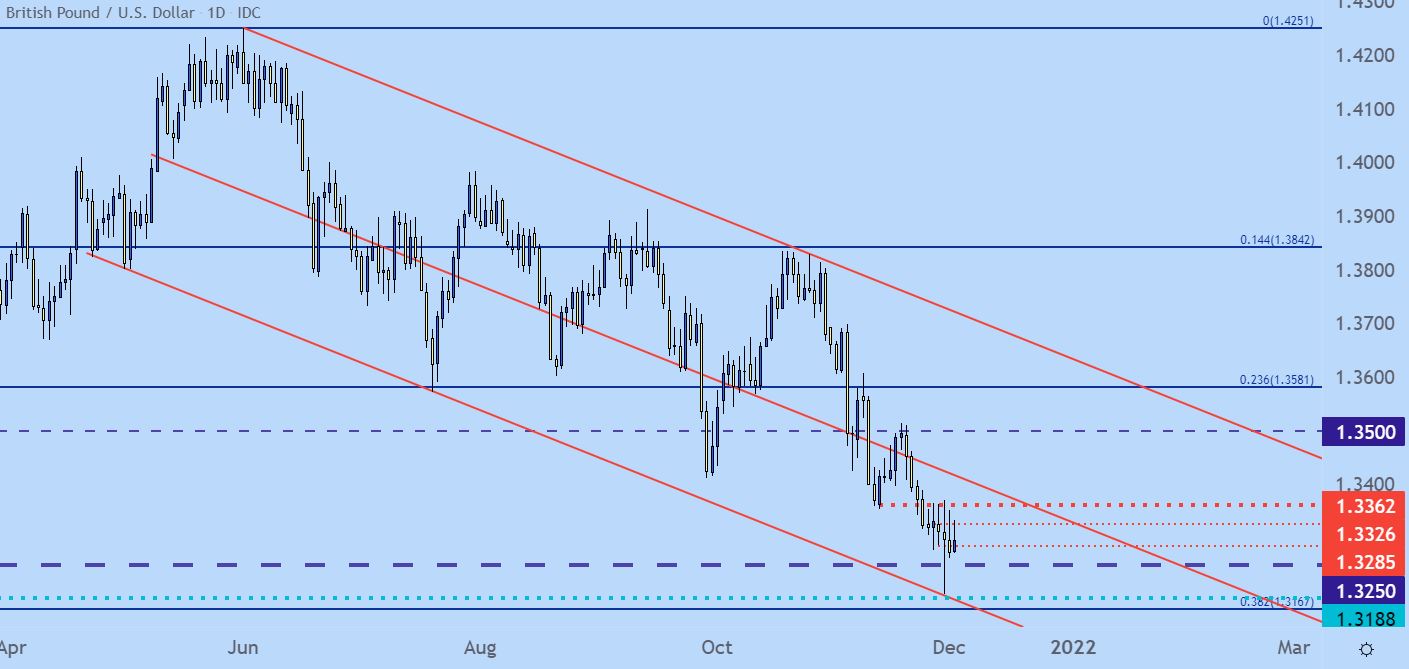
Chart prepared by James Stanley; GBPUSD on Tradingview
USDCAD Caught at Resistance
I’ve been following the long side of USD/CAD for a while now, ever since the formation of a falling wedge formation back in mid-October that opened the door for a pullback that eventually turned into a reversal. That bullish move has so far shown some incredible consistency, and I had looked at another setup there on Monday of this week.
But, at this point, its becoming obvious that resistance is tempering the move and despite bulls persistence, the number of wicks that have developed atop these four hour candles scream caution to chasing. Instead, a pullback towards the 1.2750 psychological level can make the prospect of bullish positioning more attractive again.
USD/CAD Four Hour Price Chart

Chart prepared by James Stanley; USDCAD on Tradingview
--- Written by James Stanley, Senior Strategist for DailyFX.com
Contact and follow James on Twitter: @JStanleyFX


