


US Dollar, AUD/USD, USD/CAD Talking Points:
- Last Friday gave us a quick but aggressive pullback in the US Dollar.
- The USD merely held support and buyers have since launched the currency higher.
- AUD/USD and USD/CAD remain attractive for long-USD scenarios.
- The analysis contained in article relies on price action and chart formations. To learn more about price action or chart patterns, check out our DailyFX Education section.

The US Dollar put in a strong short-term move of bearish price action in the latter portion of last week. The news driving the headlines was yet another Covid variant of unknown consequence, and markets generally abhor uncertainty. In short order, some of the strongest trends that had been established, such as the bullish move in the USD, were on their back foot. The US Dollar had lost as much as one percent on Friday’s holiday-shortened outing, even testing below the 96 level temporarily before buyers jumped in.
But, so far this week, similar to what’s showing in stocks, buyers are bidding the market higher, giving rise to the potential for bullish trend continuation scenarios.
In the US Dollar, this pullback showed up at a key spot on the chart as there are a number of support mechanisms in place around the 96 psychological level on DXY. The prices of 96.02 and 96.10 each offer retracements from longer-term Fibonacci levels and these prices had helped to form some resistance earlier in November.
US Dollar Daily Price Chart

Chart prepared by James Stanley; USD, DXY on Tradingview
AUD/USD
One of my favored vehicles for continued USD strength remains AUD/USD.
I had looked into the pair a couple of weeks ago as it was testing support in a bear flag formation. That formation has since given way to falling prices, and price action in Aussie is now finding support at another marker, right around the .7100 level.
But, that’s probably not what’s holding back bears at this point. That is likely the major psychological level cast just a 100 pips lower at the .7000 big figure. With an already oversold scenario nearing a really big level of support, sellers may calm for a bit, and this can allow for a scenario in which some lower-high resistance comes into the mix. There’s a prior spot of support around .7175 and this could function for that resistance potential in this scenario.
AUD/USD Daily Price Chart
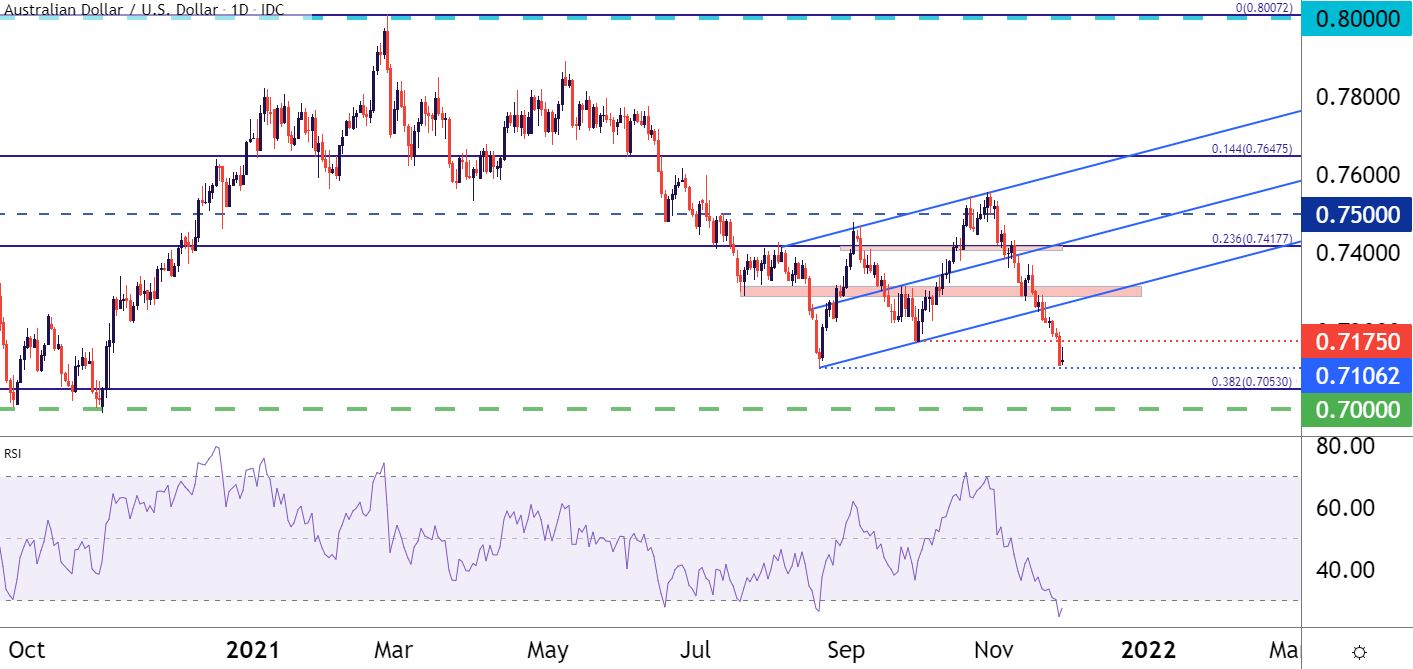
Chart prepared by James Stanley; AUDUSD on Tradingview
USD/CAD
Sticking with commodity currency pairs, I’ve been favoring the long side of the USD/CAD breakout for a while now, ever since the reversal started to show in October with a falling wedge near support. Most recently, I had looked into the matter last week, sharing the next area of higher-low support that I was looking for in order to back bullish continuation scenarios.
That’s the spot that came into play last week ahead of the breakout, testing below 1.2662 before jumping up to yet another fresh high. Current support is showing at a familiar Fibonacci retracement, around the 23.6% marker from the same study that gave a great spot of resistance-turned-support at the 38.2% retracement.
The next objective higher is 1.2814, after which the September high comes into the equation, just inside of the 1.2900 level.
USD/CAD Four-Hour Price Chart

Chart prepared by James Stanley; USDCAD on Tradingview
--- Written by James Stanley, Senior Strategist for DailyFX.com
Contact and follow James on Twitter: @JStanleyFX


