


US Dollar Talking Points:
- King Dollar has continued to rally to fresh yearly highs.
- EUR/USD has rolled over and this has contributed to that continued breakout in the USD.
- AUD/USD could be conducive for continued USD-strength, as could USD/JPY and even GBP/USD. Fading a freight train could be a difficult premise. For those looking to avoid the USD, check out the Yen.
- The analysis contained in article relies on price action and chart formations. To learn more about price action or chart patterns, check out our DailyFX Education section.
The US Dollar just keeps going…
The currency was bid as we came into Q4, owed to the September FOMC rate decision at which point the Fed had warned of higher rates on the horizon. They also said that they were planning on starting to taper asset purchases provided that labor market data didn’t massively disappoint, and in early-November, they did just that. But that rate decision had a dovish feel to it as Chair Powell wouldn’t discuss rate policy at all. This left the USD to contend with the short-term range that had built.
But last week’s inflation data created a spark and that fire still hasn’t died down as the USD has jumped to yet another fresh yearly high this morning. Coming in to help meter the move is the 2nd to last target taken from the Q4 Technical Forecast on the USD, plotted at the Fibonacci level around 95.86. There’s but one more target left in the Q4 Forecast, and the full guide is available from the link below:

Sitting just ahead is a key Fibonacci level at 96.10. This is not the final target that was spoken about above as this price was so close to the 95.86 Fibonacci level. The trend is a bit hot at the moment and chasing at current levels could be a challenge. In this webinar, I discussed a few options for working around that and below, I dig into four of the more interesting major currency pairs.
US Dollar Daily Price Chart

Chart prepared by James Stanley; USD, DXY on Tradingview
EUR/USD Burned
The relationship between the US Dollar and the Euro is often a case of co-dependency. As a matter of fact, if we drill down to last week’s inflation print, around with the US Dollar breakout really started to heat up, there’s a tie to the Euro and EUR/USD. I discussed this during the webinar but, at this point, EUR/USD is massively oversold and there’s been little pullback to sell into.
Given how aggressively this has fallen with the lack of any nearby signs of support, it would appear lackluster for reversal plays. What could make the pair more enticing again is a pullback to lower-high resistance: There’s a 30-pip range where support had attempted to set after this week’s open, and that could be looked at as an aggressive spot. A bit higher is the big zone of longer-term support that runs from 1.1448-1.1500. The next support on my chart is around 1.1291, which is the 61.8% Fibonacci retracement of last year’s bullish run in the pair.
EUR/USD Four Hour Price Chart

Chart prepared by James Stanley; EURUSD on Tradingview
GBP/USD: At Least it’s Trying
Similar look in GBP/USD as the pair pushed down to a fresh yearly low in the midst of the US Dollar breakout. The difference here is in the past couple of days, as GBP/USD has at least tried to bounce after that bearish breakdown.
From the GBP/USD chart, there’s still bearish motive but the series of higher-highs and lows shown on the four-hour chart may be opening the door for some bullish price action. I shared a cut-off level in the webinar for that theme but traders may be able to extrapolate that scenario on the long side by looking at bullish potential GBP/JPY instead.
GBPUSD Hourly Price Chart
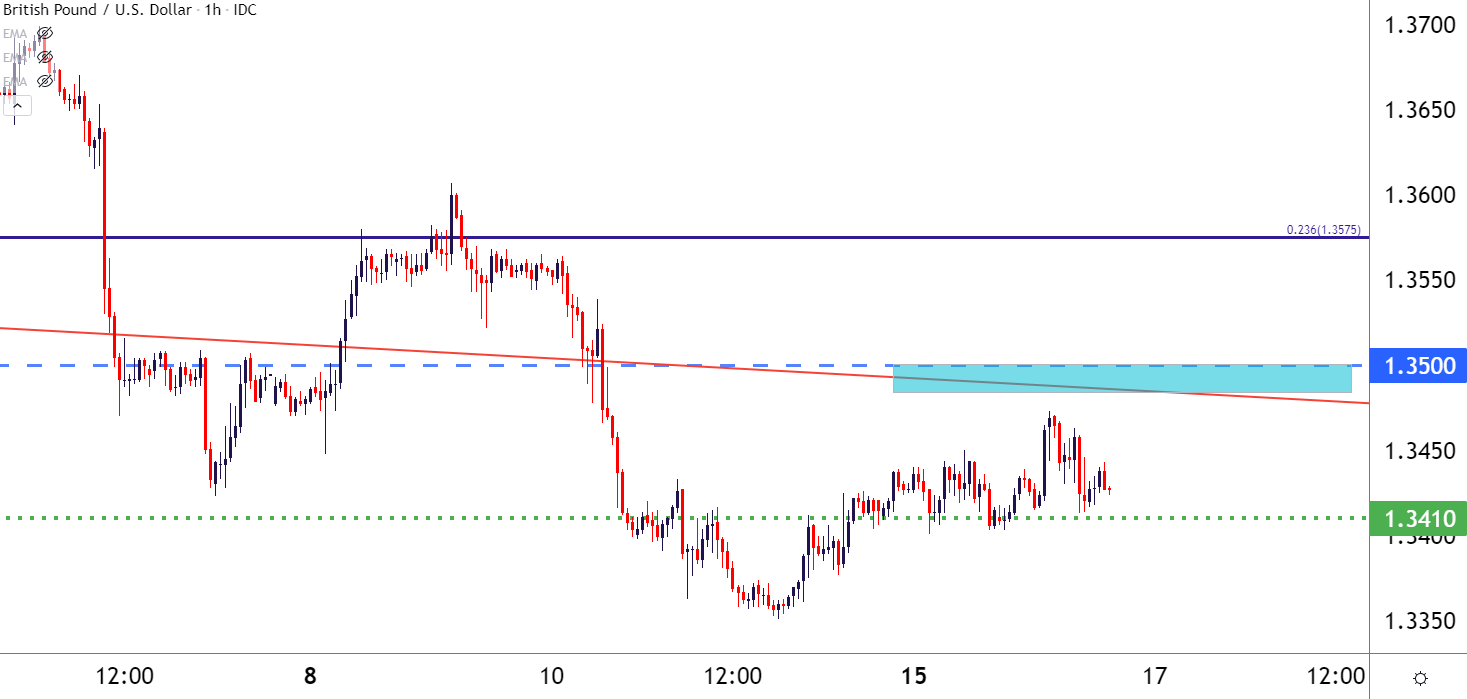
Chart prepared by James Stanley; GBPUSD on Tradingview
AUD/USD Breakdown Doesn’t Look Done Yet
The RBA had a dovish Central Bank meeting even ahead of the FOMC and this led to a strong pivot in AUD/USD price action. Ahead of the announcement, the pair was hanging above the .7500 psychological level. After – prices had taken out that support on the way to a fresh near-term low, and that bearish trend has only continued.
At this point, price action is caught in a spot of support around the 23.6% retracement of the May-August sell-off. There’s also a bear flag formation here, taking the bullish trend that had developed over the past couple of months in consideration with the prior bearish trend.
This keeps the door open for weakness and this meshes with USD-strength scenarios.
AUD/USD Daily Price Chart
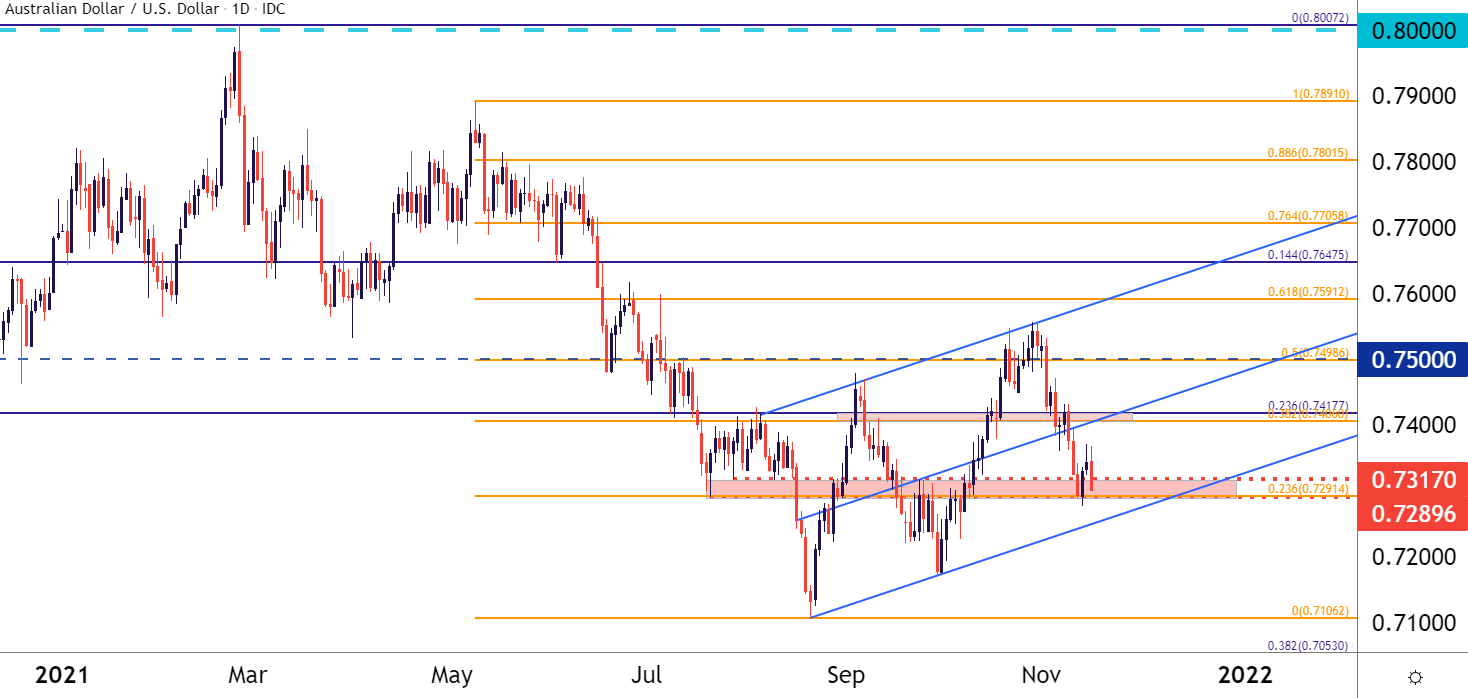
Chart prepared by James Stanley; AUDUSD on Tradingview
USD/JPY Back Up to a Big Level
USD/JPY put in a stark run to start Q4, very similar to the Q1 outlay as Japanese Yen weakness was driving on the back of higher US rates. USD/JPY came very close to testing the November, 2017 high at 114.74 before pulling back.
After the September FOMC rate decision, prices continued pulling back but after last week’s inflation print, the bullish trend came alive and price action jumped right back up to that 114.74 level. Just beyond that is another key level at the psychological level of 115.00.
As shared in the webinar, this is a theme that could be extrapolated elsewhere, such as GBP/JPY.
USD/JPY Weekly Price Chart
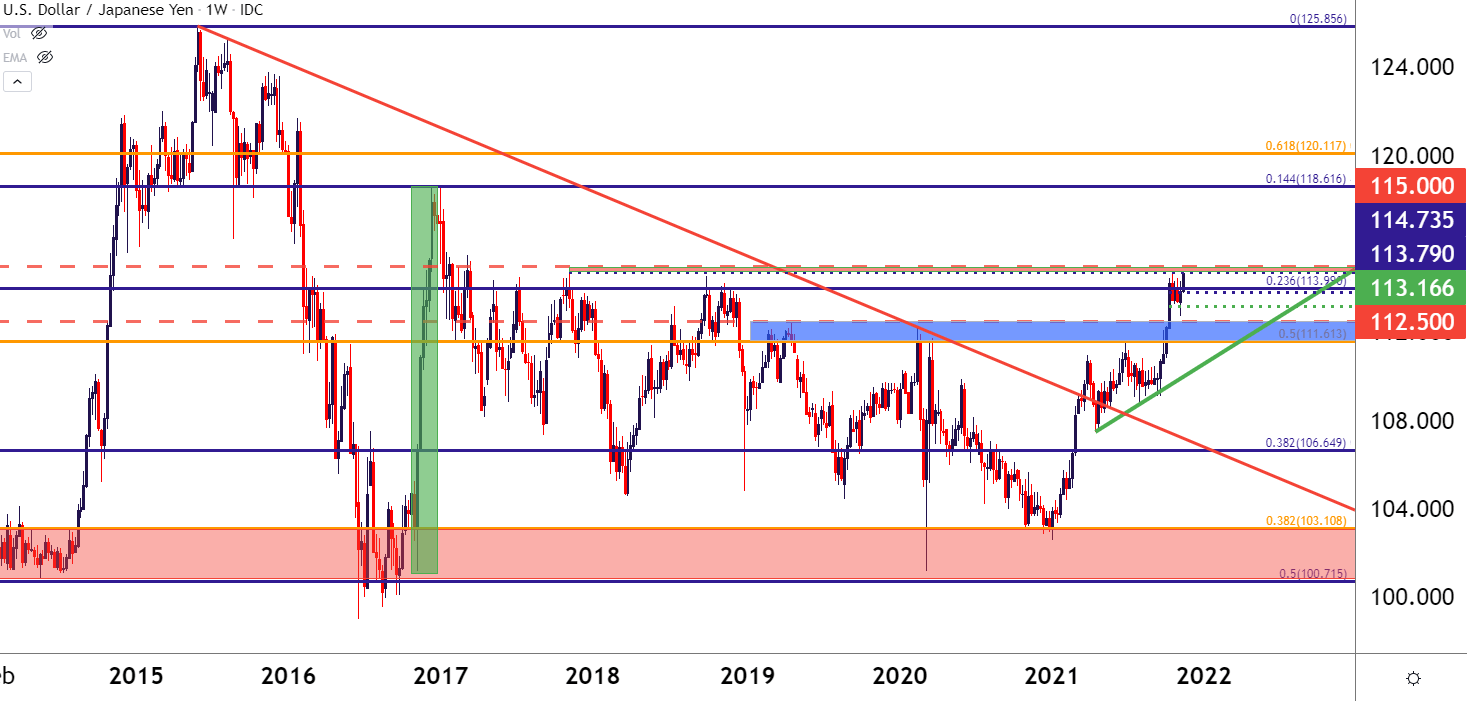
Chart prepared by James Stanley; USDJPY on Tradingview
--- Written by James Stanley, Senior Strategist for DailyFX.com
Contact and follow James on Twitter: @JStanleyFX


