


Talking Points:
- Price action remained abnormally busy for a summer Thursday, driven by Chair Powell speaking on Capitol Hill.
- Tomorrow’s economic calendar brings Retail Sales and U of Mich Consumer Sentiment out of the United States.
- The analysis contained in article relies on price action and chart formations. To learn more about price action or chart patterns, check out our DailyFX Education section.

It’s been an abnormally busy Thursday in the summer as markets remained fairly busy throughout the session. Of course, FOMC Chair Jerome Powell speaking at part two of the Fed’s Humphrey Hawkins testimony contributed to the drive; but that certainly wasn’t all as there were a few different themes of note in the headlines. This article will look at some of the more prominent.
Did Oil Just Top?
A widely-followed financial pundit with a television show made a brash call today, saying that oil prices have topped. This caught a ton of attention as oil prices have been in the midst of a one-way move over the past couple of months, and just last Tuesday touched up to a fresh six-year-high.
Prices have been snagged at resistance since that test last week, however, but as we pointed out in the recent Analyst Pick on oil, this is a big zone of resistance with multiple levels in tight proximity. I had started looking at bullish breakout potential in late-May as oil prices were angling up to another key zone, and an explosive movement showed thereafter. So, it makes some sense for prices to calm after an exuberant run tested through a massive level on the chart.
But has oil topped? There’s not yet enough information to suggest as such. For traders looking to fade this recent breakout, awaiting a test below the 70 psychological level and, further, the 64.31-67.19 zone seems a prudent indication to follow before looking to get bearish on a trend that’s been extremely bullish for the past two months.
To learn more about psychological levels, check out DailyFX Education
Crude Oil Daily Price Chart
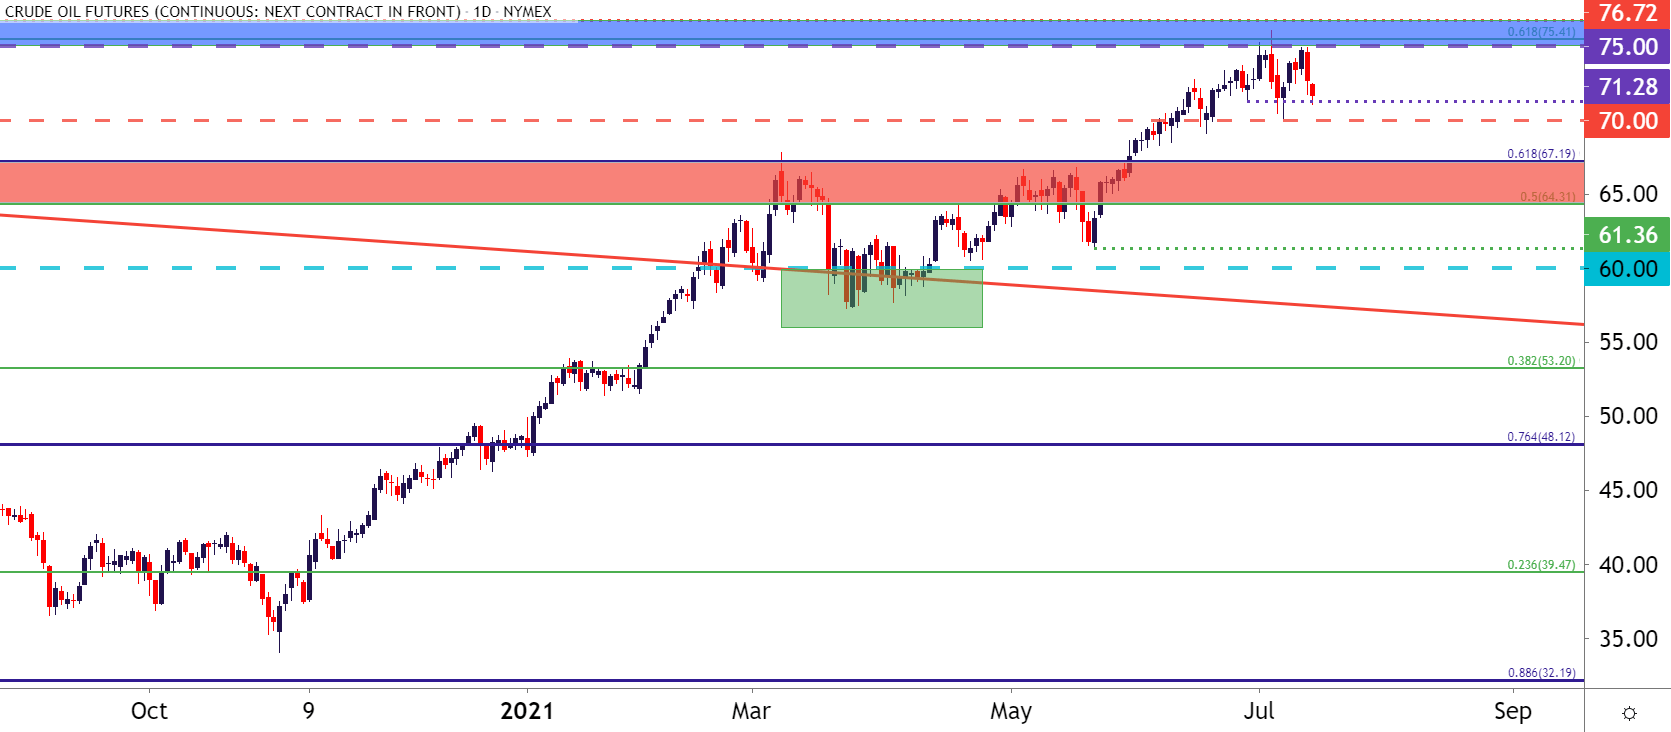
Chart prepared by James Stanley; CL2 on Tradingview
USD, JPY Strength
An interesting observation in FX-land of recent has been the general strength showing in anti-risk currencies like the USD or JPY.
I had looked into the Japanese Yen last week, tying that Yen strength in with the continued drop in US yields. That pressure has yet to relent, and Yen-strength continues to show visibly against many major currencies, the US Dollar included.
Chair Powell’s comments on Wednesday and Thursday proved unhelpful to the theme as US yields continued to drop as Yen-strength continued to build. This sets up for a fairly interesting scenario for the days/weeks ahead, particularly if we do see some element of risk aversion pop up in global markets.

With both bonds and stocks heading higher of recent, the question begs ‘which one is right?’ Often, bonds are the signal to follow, and if that remains the case, and if yields continue to dip, then there may be a summer surprise not too far off in the distance, and Yen bulls may be able to benefit from that. Below I look at EUR/JPY as the pair has pushed down for a re-test of the level that caught the lows last week. Last week’s test bounced into a lower-high, giving the appearance of bearish breakout potential as that price comes back into play.
EUR/JPY Daily Price Chart
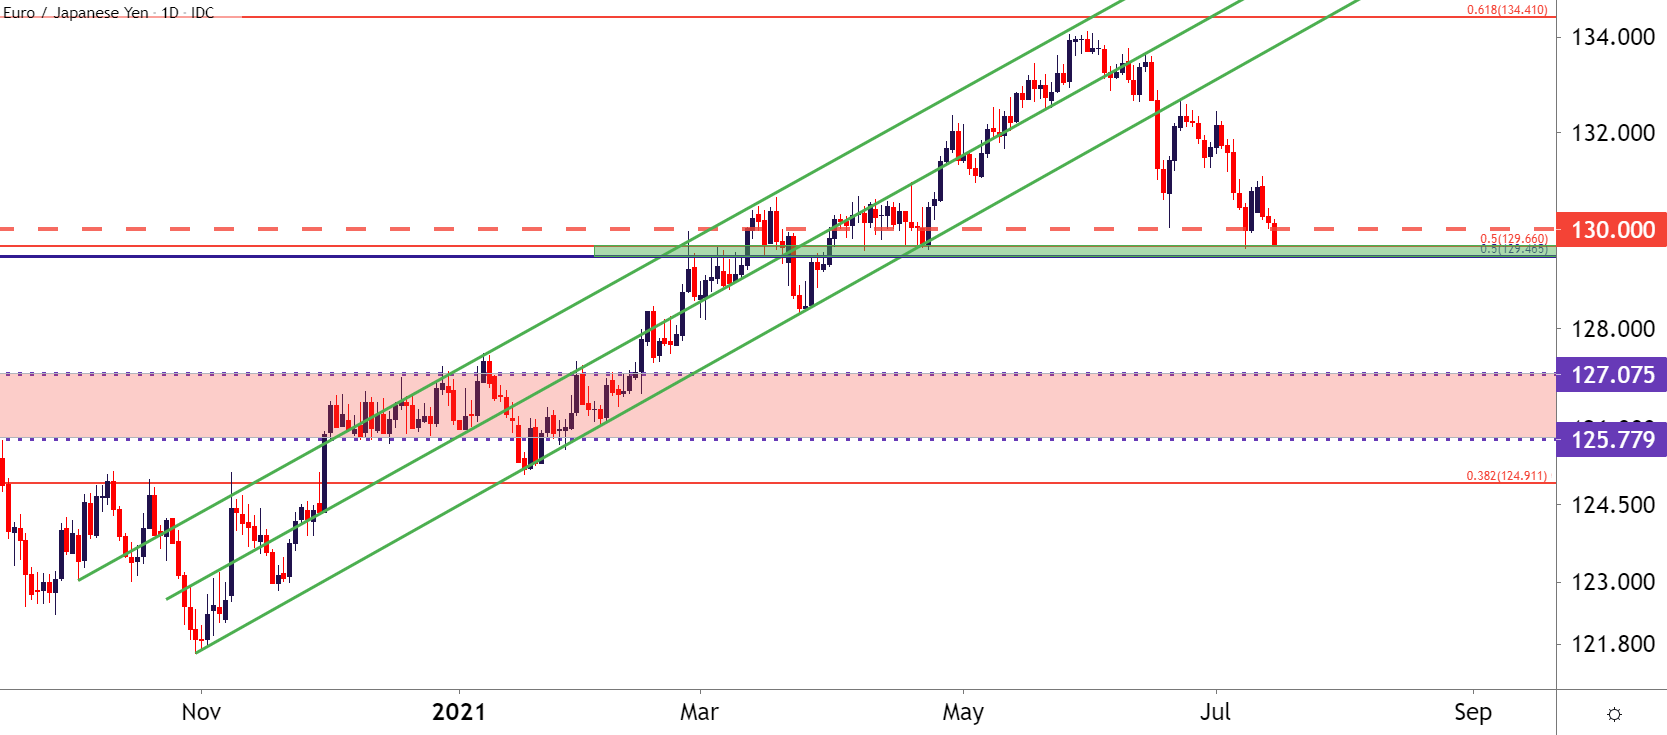
Chart prepared by James Stanley; EURJPY on Tradingview
BTC, Crypto Breakdown Potential
The meme stock manias from earlier this year seem a bit more distant now as both AMC and Gamestop have been on offer over the past week. But even the crypto space appears to be getting less attention, and today there appeared to be some fairly bearish prognostications on the space from a number of different outlets. Jeff Gundlach had some interesting comments on the matter, saying that the Bitcoin chart looks ‘scary’ at the moment.
He also had some interesting comments back in May, saying that cryptocurrencies were the poster child for the speculative fervor coursing through markets, and he highlighted how the sell-off in Bitcoin may be signaling that the fervor was calming.
Since then, Bitcoin hasn’t yet broken down but it hasn’t exactly been bullish, either. The same support zone that came into play in mid-May remains in-play today. And while the initial bounces back in May or early-June could lead to a run up to the 40k level, more recently, those bounces have been showing a diminishing impact, and now there’s a descending trendline sitting atop price action.
That makes for a descending triangle formation – often approached with the aim of bearish breakdowns. That can be a scary thing, particularly to those who are long.
To learn more about the descending triangle formation, check out DailyFX Education
BTC/USD Daily Price Chart
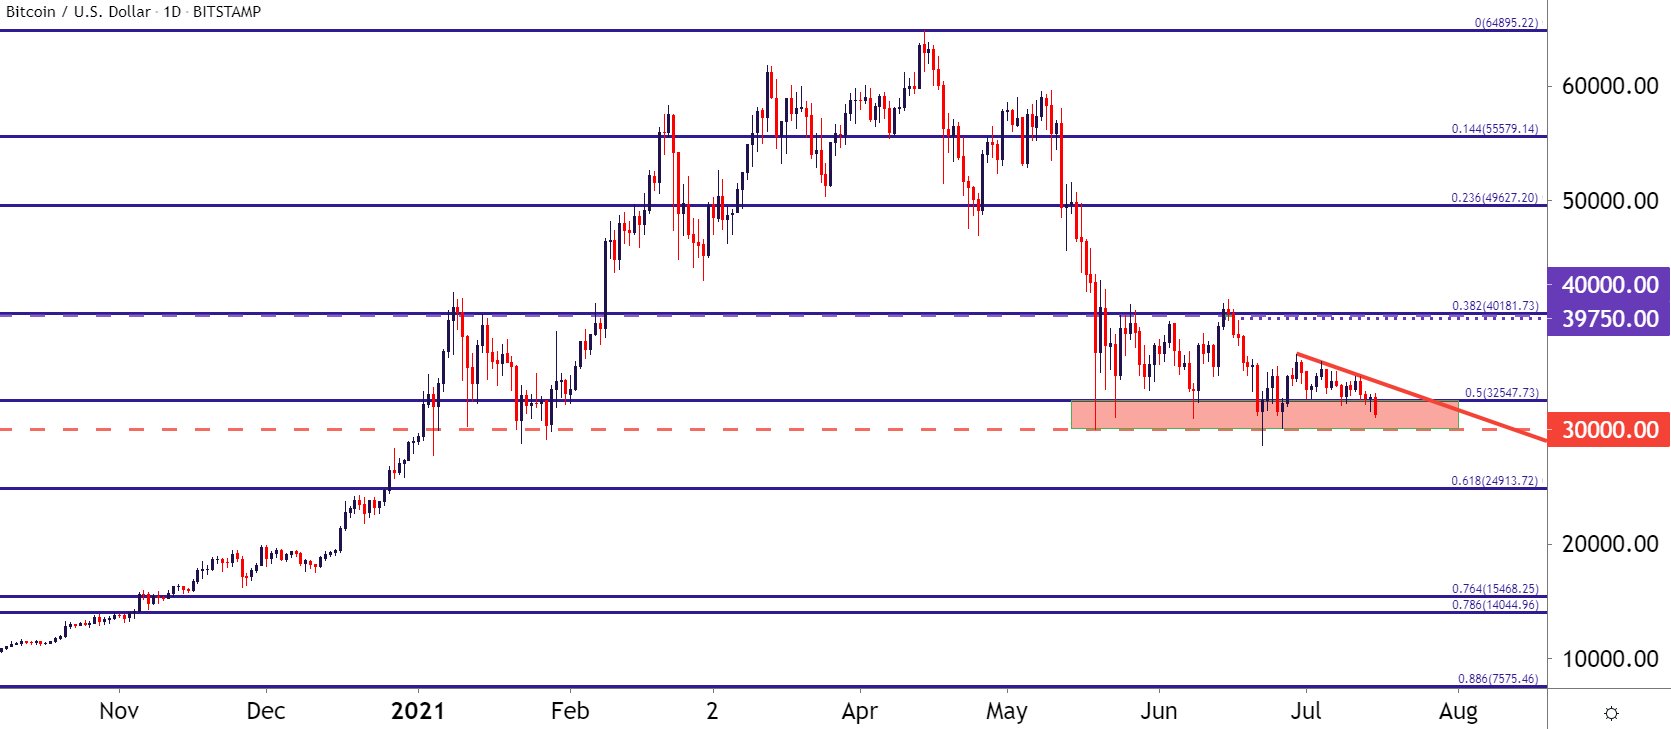
Chart prepared by James Stanley; Bitcoin on Tradingview
--- Written by James Stanley, Senior Strategist for DailyFX.com
Contact and follow James on Twitter: @JStanleyFX


