


WTI Crude Oil Talking Points:
- The bullish trend has continued in Oil, with prices jumping up to a key zone of resistance.
- So far that resistance has held but bullish momentum has been impressive, might buyers have enough left in the tank to take out this key zone?
- The analysis contained in article relies on price action and chart formations. To learn more about price action or chart patterns, check out our DailyFX Education section.
While many commodities have been heavily on offer of recent, the bullish trend in crude oil has continued and prices are threatening to break out to a fresh six-year-high. But, to put this in context, we are now seeing crude oil prices testing a big batch of resistance on the chart that may carry some bigger-picture implications.
I had looked into the potential for a breakout in Oil in late May, and then again last month as it appeared that a bigger breakout may be afoot.
At this point, oil prices have run into a big area of resistance, taken from a confluent area on the chart with quite a bit going on. First, we have the psychological level at $75, after which we’re looking at the 61.8% Fibonacci retracement of the 2001-2008 major move. Just beyond that is the six-year-high, which on the CL2 chart below is plotted at 76.72.
Collectively, this confluent spot offers a zone of resistance that’s represented in the below chart with a blue box.
To learn more about psychological levels or Fibonacci, check out DailyFX Education
Crude Oil Monthly Price Chart (CL2)

Chart prepared by James Stanley; CL2 on Tradingview
Crude Oil Priming for Pullback?
When I had looked into the matter in May, it was the weekly chart that was really compelling as this is what showed buyers stepping in after resistance had shown around the $67-level. The initial zone of resistance that was encountered in this recent breakout was not new; as this same spot had helped to mark the highs in both 2019 and 2020. And for a while, this statement held true for 2021, as prices pushed up for a test in March but failed.
It was what happened after that that made this interesting. Buyers stepped in around a trendline projection and for five straight weeks, from mid-March into early-April, helped to hold the lows on the basis of that prior resistance trendline. Prices soon returned to the resistance zone and, in early-June, broke out.
But now there’s another item taken from the weekly chart, and that’s diverging RSI indicating that this trend may be long-in-the-tooth and prime for a pullback. This doesn’t necessarily obviate the trend but, it does make for a more difficult bullish case in the immediate future.

Crude Oil Weekly Price Chart

Chart prepared by James Stanley; CL2 on Tradingview
Crude Oil Strategy Near-Term
At this point, bullish continuation strategies can become difficult given the area of resistance that’s in-play; and reversal strategies could equally be challenged as all that we’ve seen thus far is a simple hold of resistance. The trend, at this point, remains undeniably bullish but the big question is whether this zone can elicit enough sellers to keep a cap on price and, if so, for how long that might last?
This could be enough to encourage a bit of patience for those looking to trade crude higher and, rather than chasing the trend, traders may want to wait for prices to settle in the effort of catching higher-low support.
From the Daily chart below, we can see a few different points of interest for support potential. There’s a nearby price swing around 71.28, and this nearby spot could be looked to as an ‘s1’ area of support. A bit deeper, we have the $70 psychological level, which exhibited both resistance on the way up and support after the break; and this can be looked at as an ‘s2’ level. And below that, we have the big batch of prior resistance that hasn’t yet seen a support test. This zone held the highs over a three-year-period before the breakout, so it would be surprising (at least to me) if bulls were to just completely leave this zone behind without so much as checking back for support at some point. This could be classified as an ‘s3’ zone of support, and spans from 64.31-67.19.

Crude Oil Daily Price Chart
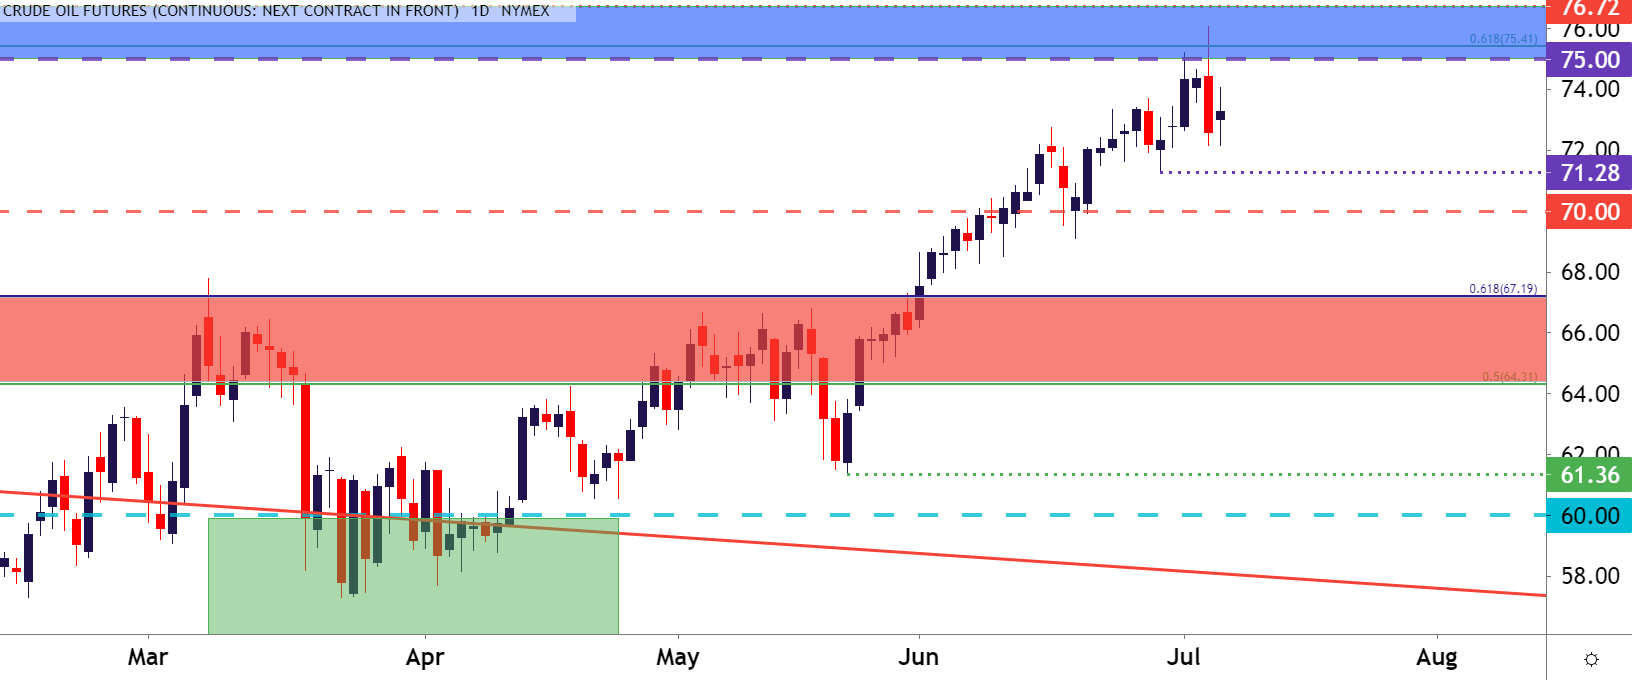
Chart prepared by James Stanley; CL2 on Tradingview
--- Written by James Stanley, Senior Strategist for DailyFX.com
Contact and follow James on Twitter: @JStanleyFX


