


WTI Crude Oil Talking Points:
- Oil prices hit a fresh two year high to start this week’s trade.
- Buyers remain large and in-charge of crude oil prices, the bigger concern would be short-term dynamics as oil prices have been up for 13 of the past 16 trading days.
- The analysis contained in article relies on price action and chart formations. To learn more about price action or chart patterns, check out our DailyFX Education section.
It’s been a big month for crude oil. After setting up for a bullish breakout in late-May, buyers jumped in and drove WTI up to a fresh two-year-high, eventually crossing above the $70 figure for the first time since October of 2018. And bulls remain large and in-charge at this point, with oil prices moving higher for 13 of the past 16 trading days as that breakout has taken-hold.
But, the fear at this point would be whether the market has run too far too fast, or whether we’re nearing overbought conditions that may highlight pullback potential. And to be sure, RSI is making a fast move into overbought territory on the daily although it’s not quite there yet. This isn’t necessarily a contra-signal nor does it negate the bullish trend, but it does highlight how this can be a difficult spot to begin establishing fresh exposure.
WTI Crude Oil (CL2) Daily Price Chart

Chart prepared by James Stanley; CL2 on Tradingview
Oil Support Potential
In the article looking at the potential breakout, I talked about why the area of resistance in play at the time was so important. There’s a number of items pointing to support/resistance potential but, the most important is reality as this zone helped to set the swing high in 2019, 2020 and (at the time) 2021.
But, now that this big zone of resistance has finally been taken-out, it’s now support potential in the event that prices pullback. This zone runs between Fibonacci levels at 64.31 and 67.19.
WTI Crude Oil (CL2) Monthly Price Chart
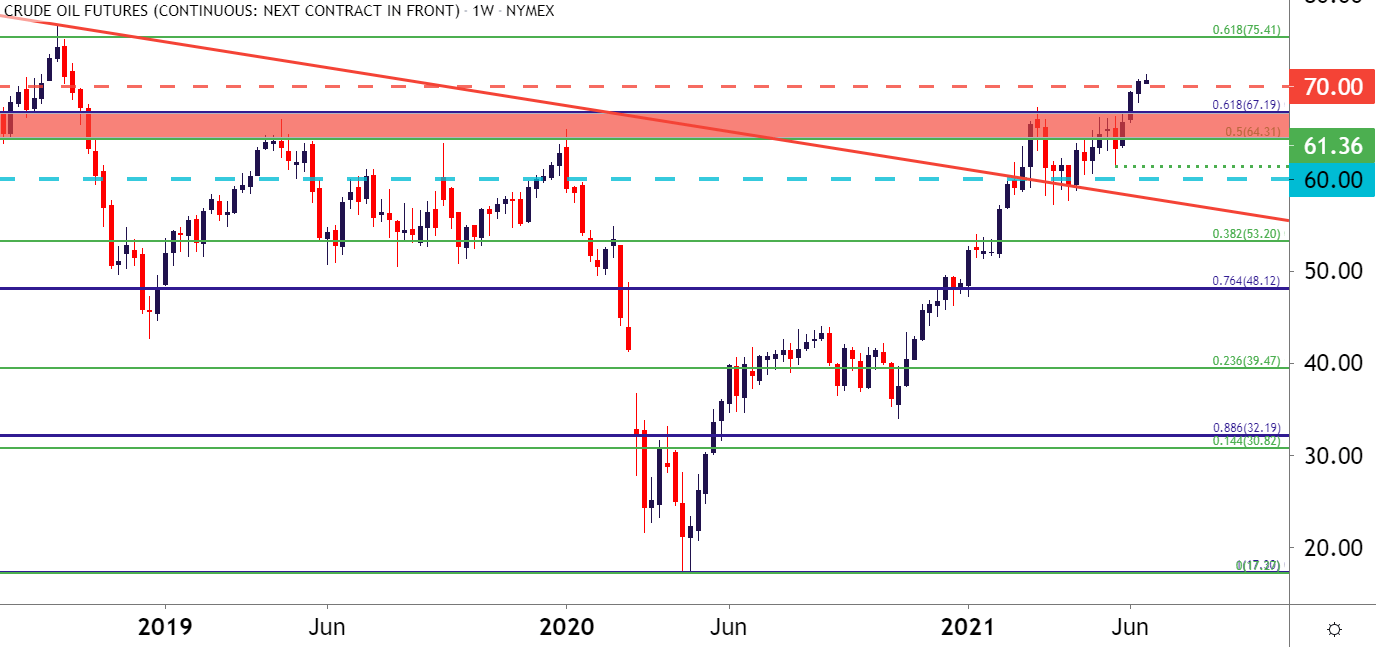
Chart prepared by James Stanley; CL2 on Tradingview
Oil Resistance Potential
If bulls are able to retain control here, the next big spot on my chart is around the 75 handle. Once again, there’s a bit of confluence here as a Fibonacci level lines up very closely with the psychological level at 75. This is the 61.8% Fibonacci retracement of the 2013-2020 major move, and is also very near the 2018 swing high.
To learn more about Fibonacci, check out DailyFX Education
WTI Crude Oil Monthly Price Chart
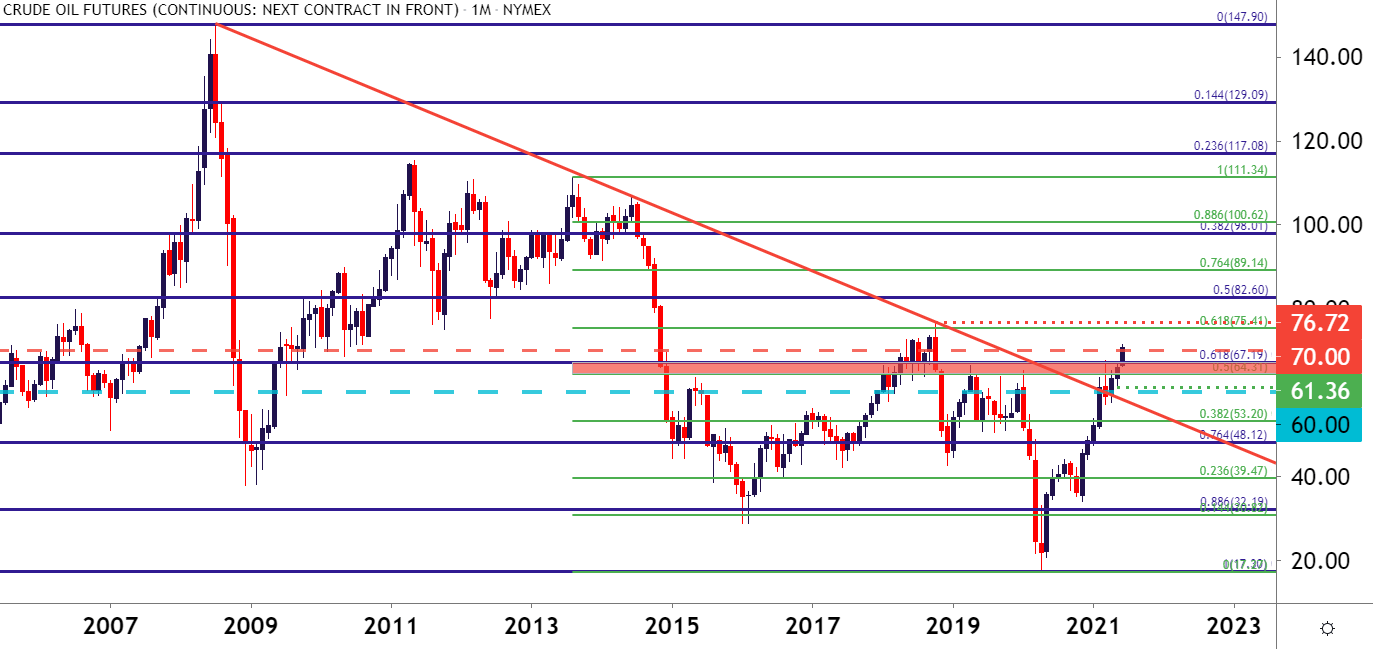
Chart prepared by James Stanley; CL2 on Tradingview
--- Written by James Stanley, Senior Strategist for DailyFX.com
Contact and follow James on Twitter: @JStanleyFX


