


US Dollar, EUR/USD, USD/JPY, USD/CAD Talking Points:
- It has been a strong start to Q3 for the US Dollar after a rough outing in June. The US Dollar has moved back-up to an area of prior support/resistance around the 97.35 level on DXY. The big item on the economic calendar for this week is FOMC Chair Jerome Powell’s Humphrey Hawkins testimony in front of Congress, set to take place on Wednesday and Thursday.
- This re-emergence of USD-strength has been unevenly distributed, showing visibly against the Euro but a bit less so against the Japanese Yen. In USD/CAD, the pair has been almost immune to that run of USD-strength as CAD has been even stronger. This can help demarcate strategy around the Greenback for this week.
- DailyFX Forecasts are published on a variety of markets such as Gold, the US Dollar or the Euro and are available from the DailyFX Trading Guides page. If you’re looking to improve your trading approach, check out Traits of Successful Traders. And if you’re looking for an introductory primer to the Forex market, check out our New to FX Guide.
US Dollar Claws Back June Losses in Early Q3 Reversal
The US Dollar has gapped-higher to start this week’s trade, continuing a topside ramp from last week as the month of July has started in a much friendlier manner to USD bulls than the way that June had ended. While last month was punctuated with lower rate expectations around the United States, July has so far seen odds around future rate cuts slim, helping the US Dollar to bounce from the fresh three-month lows that were created just two weeks ago.
At this point, the Greenback is finding resistance at a prior area of interest. The level of 97.35 is a prior swing-high that soon re-appeared as support; and this shows up after buyers pushed the bid beyond resistance at prior trend-line support. Sitting higher on the chart, the 97.70 level that had previously functioned as the yearly high remains as potential resistance.
US Dollar Four-Hour Price Chart
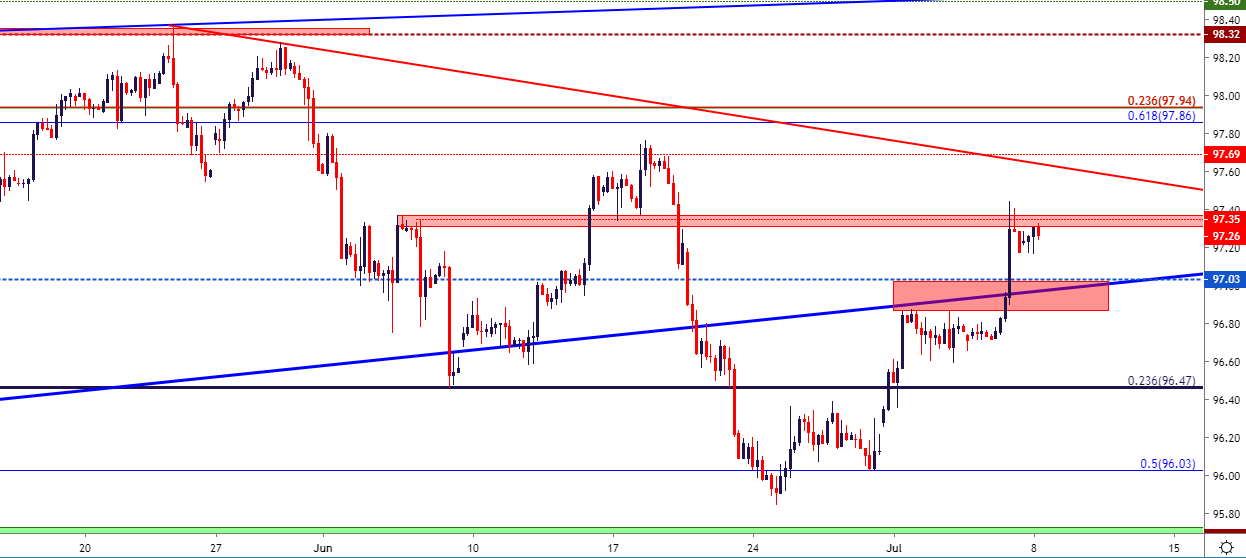
Chart prepared by James Stanley
EUR/USD Pushes Back Down to Fibonacci Support
The level of 1.1212 has some history in EURUSD. This is the 61.8% retracement of the ‘lifetime move’ in the pair, taking the 1999 low up to the 2008 high. This price helped to demarcate resistance for an almost two-year period as the pair ranged above the parity figure. Prices broke out above this level in 2017; and eventually returned down to this price to find support in November of last year. Since then, there’s been numerous inflections at this spot on the chart, and bears haven’t been able to make much fresh ground below. A series of bear traps developed around the 1.1100 level in Q2 until, eventually, buyers were able to push a short-squeeze in the pair as US rate expectations were getting kicked-lower. But, as USD strength has returned on the Q3 open, prices in EURUSD have pushed right back down to this level, finding support after NFP on Friday and holding into this week’s trade.
EURUSD Four-Hour Price Chart
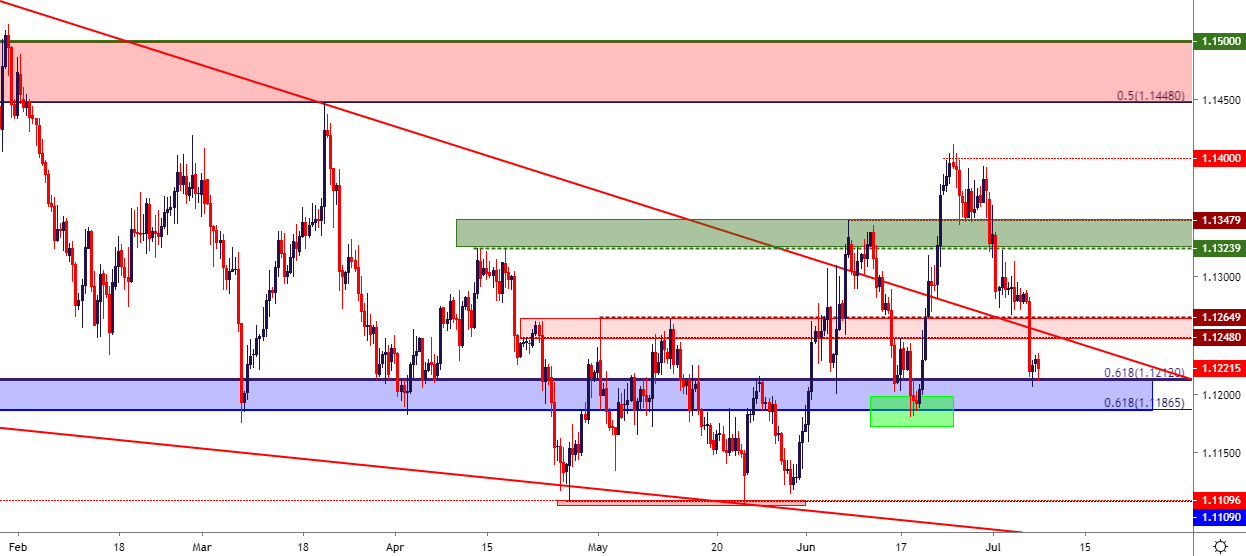
Chart prepared by James Stanley
USD/JPY Returns to Resistance
In a milder version of the above in EUR/USD, US Dollar strength has pushed USDJPY back up to a resistance zone that’s been in-play for over a month. The big question is whether this can hold or whether US Dollar bulls pose a continued forward-push. A break-above the 108.80 swing-high from June opens the door for deeper resistance tests, around the 109.00 level and then a bit-higher, taken from the 109.67-110.00 zone that was last in-play in late May.
USDJPY Four-Hour Price Chart
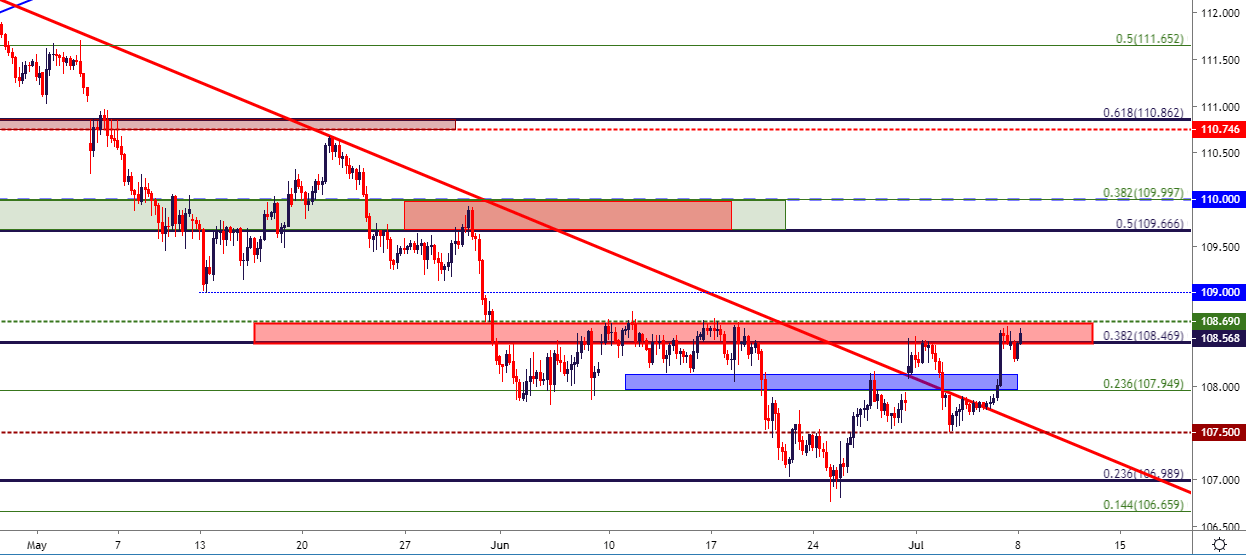
Chart prepared by James Stanley
USDCAD Presses the Lows Despite USD-Strength
When a market doesn’t rally on good news, something is amiss; and likewise, when a currency pair does not rally despite strength being seen in the base currency of the pair, something else is going on.
USDCAD has a fairly attractive example of this theme at the moment as the pair continues to press the lows despite this recent theme of USD-strength. This points to the fact that the Canadian Dollar has been really strong of late, following the inflation spike seen in the end of last month combined with a less-dovish backdrop around the Bank of Canada.
As looked at a couple of weeks ago, the short-side of USDCAD retained breakout potential. The pair was sitting above the 1.3132 level at the time, with a Fibonacci level around 1.3065 lurking below. Prices have seen filled that theme in, with the deeper Fib level helping to mark the current lows.
USDCAD Daily Price Chart
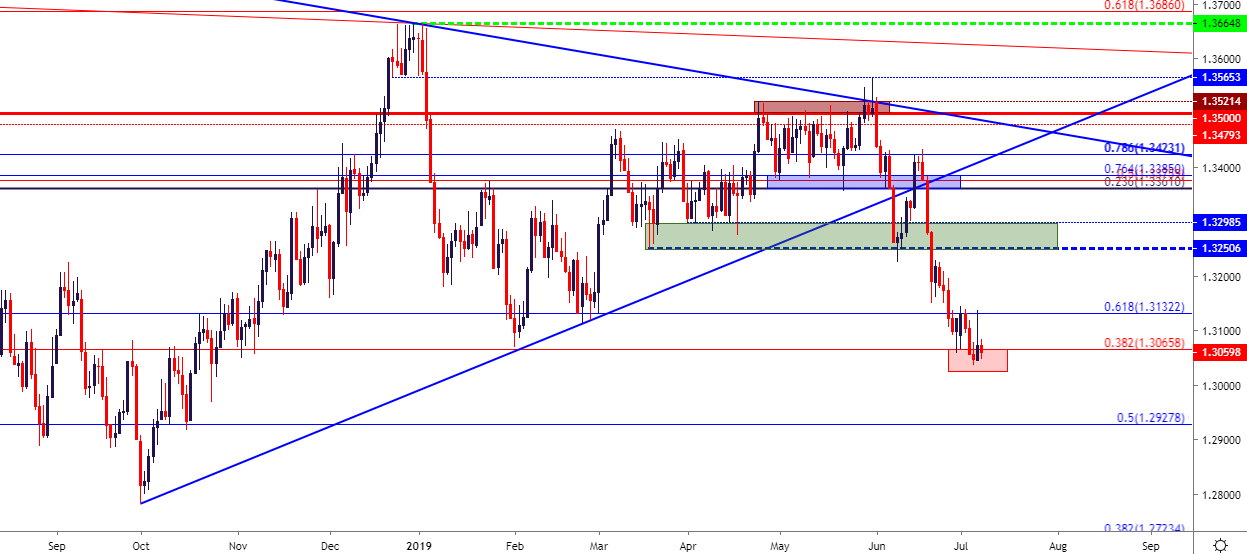
Chart prepared by James Stanley
This type of observation can have a few different ramifications: For traders that want to look for USD-weakness to come back after DXY has ran into resistance, the short-side of USDCAD may remain as attractive. Alternatively, for traders that want to avoid the US Dollar altogether, the theme of CAD-strength may remain as workable elsewhere, such as against the Japanese Yen, for instance. Or perhaps EUR/CAD could be of interest for similar drives, as the pair is in the process of breaking-below a multi-year trendline after remaining range-bound for much of the prior five months.
EURCAD Weekly Price Chart
Chart prepared by James Stanley
To read more:
Are you looking for longer-term analysis on the U.S. Dollar? Our DailyFX Forecasts have a section for each major currency, and we also offer a plethora of resources on Gold or USD-pairs such as EUR/USD, GBP/USD, USD/JPY, AUD/USD. Traders can also stay up with near-term positioning via our IG Client Sentiment Indicator.
Forex Trading Resources
DailyFX offers an abundance of tools, indicators and resources to help traders. For those looking for trading ideas, our IG Client Sentiment shows the positioning of retail traders with actual live trades and positions. Our trading guides bring our DailyFX Quarterly Forecasts and our Top Trading Opportunities; and our real-time news feed has intra-day interactions from the DailyFX team. And if you’re looking for real-time analysis, our DailyFX Webinars offer numerous sessions each week in which you can see how and why we’re looking at what we’re looking at.
If you’re looking for educational information, our New to FX guide is there to help new(er) traders while our Traits of Successful Traders research is built to help sharpen the skill set by focusing on risk and trade management.
--- Written by James Stanley, Strategist for DailyFX.com
Contact and follow James on Twitter: @JStanleyFX


