


US Dollar, EUR/USD, USD/JPY, AUD/USD Talking Points:
- The US Dollar has put in a bounce to start Q3 trade, with sellers showing up to offer resistance at the underside of a prior bullish trend-line.
- This keeps the door open for themes of weakness in the Greenback, and scenarios around EUR/USD or USD/JPY can be conducive for such themes. On the other side or for traders looking at USD-strength, AUD/USD remains of interest.
- DailyFX Forecasts are published on a variety of markets such as Gold, the US Dollar or the Euro and are available from the DailyFX Trading Guides page. If you’re looking to improve your trading approach, check out Traits of Successful Traders. And if you’re looking for an introductory primer to the Forex market, check out our New to FX Guide.
US Dollar Scales Back, Finds Resistance at Rising Wedge Support
The Third Quarter has started with a bit of retracement in the US Dollar. The currency had broke-lower in the month of June around a dovish flip at the FOMC, with prices in DXY dipping-down for a fresh two-month-low. And as looked at in the Q3 technical forecast for USD, the backdrop leading into that break can keep the door open for bearish approaches in the currency as the door has opened into the second-half of 2019.
The first few days of Q3, however, have seen a bit of pullback in that bearish trend. The area for lower-high resistance potential looked at yesterday, plotted from around the underside of the support portion of that rising wedge, has since come in to help carve-out short-term resistance. For traders looking to sell the Greenback, this could be an interesting area to investigate for such strategies, with particular emphasis paid to a couple of currency pairs that have shown last week’s USD weakness with a bit more prominence.
US Dollar Daily Price Chart: Bounce from Two-Month-Lows

Chart prepared by James Stanley
EURUSD Pulls Back Towards Trend-Line Support
Of the pairs that showed the June pattern of weakness in the US Dollar fairly-well, EURUSD is on the list. And to be sure, this isn’t because of any particularly bullish factors around the Euro-zone; but more likely due to the elongated short-side trend that had been in-place for more than a year. In the month of May, this set a series of bear traps on the underside of Euro price action; but sellers were continually thwarted at the 1.1100 level, suggesting a longer-term oversold dynamic in the pair.
The June gasp of weakness in USD helped EURUSD to incline up to fresh two-month-highs, like emanating from a short-squeeze scenario as the US Dollar and FOMC forward-looking policy came into further focus. Should that theme continue, there could be more topside yet in EURUSD.
At this point, the pair has scaled below the support zone at 1.1325-1.1350, and a bit-lower is another area of support potential that runs from 1.1248-1.1265, spanning the May swing-highs in the pair. A hold of support at this level keeps the door open for topside strategies with stops investigated below the Fibonacci level at 1.1187 that helped to quell the mid-June pullback in the pair.
EURUSD Eight-Hour Price Chart

Chart prepared by James Stanley
USDJPY Re-Tests Key Resistance
Also on the side of USD-weakness, USDJPY may retain some appeal. The pair had a strong first four months of the year, but May price action brought upon change as sellers started to make their mark, and that theme has lasted into the end of Q2.
The backdrop around USDJPY is a little different than the above scenario in USD. In USDJPY, the short-side of the pair can remain particularly attractive given the appeal of the anti-risk Yen should risk aversion scenarios creep-in again. And while that may be difficult to imagine given the bullish backdrop in stocks, the bullish backdrop in bonds suggests that the potential for risk aversion remains.
USDJPY Daily Price Chart
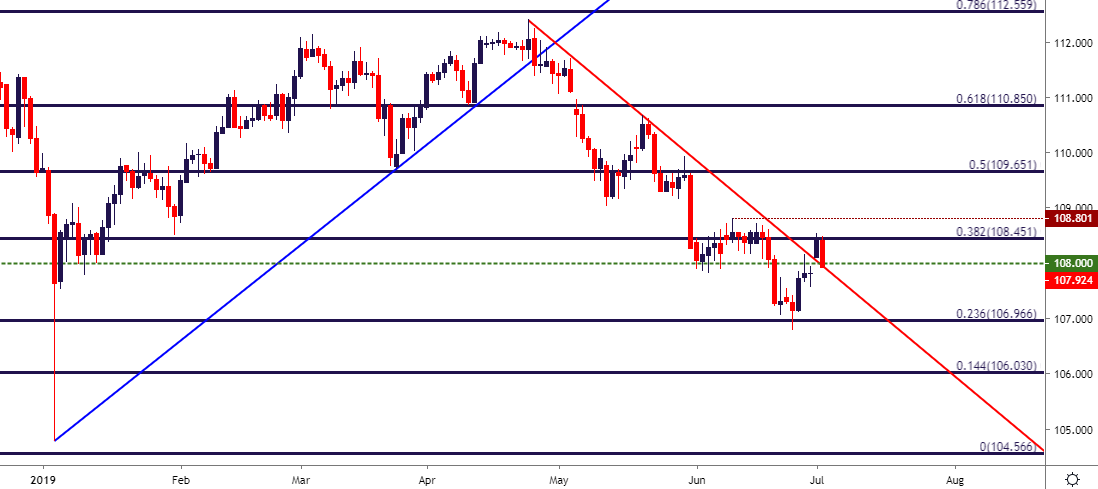
Chart prepared by James Stanley
At this point, USDJPY is coming off of a zone of resistance that was in play throughout June trade, taken from the 38.2% Fibonacci retracement of the November 2017 – March 2018 major move. This week’s price action has now almost filled the opening-gap that showed up in the pair; but for traders that do want to look at short-side themes, they’d likely want to wait for a breech of the 107.50 level, which was last Friday’s swing-low, to re-open the door for a downside test of the 107.00 handle. The primary complication would be the recent series of higher-highs and higher-lows that have developed, keeping the door open for a deeper retracement of the May-June bearish theme.
USDJPY Four-Hour Price Chart
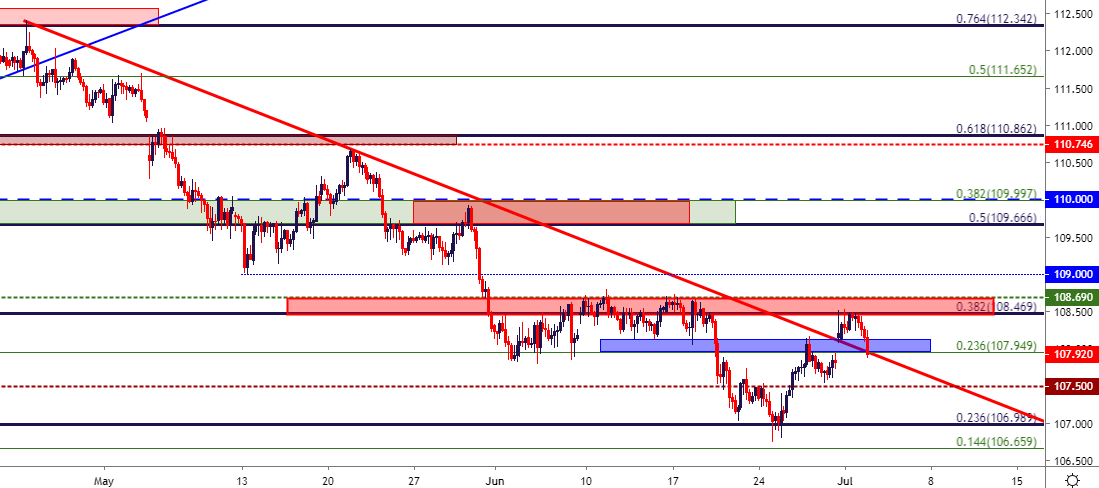
Chart prepared by James Stanley
AUDUSD Bearish Engulfing on Day One of Q3
On the long side of the US Dollar, AUDUSD can remain of interest. The pair put in a resistance inflection in mid-June that led into fresh five-month-lows. As USD-weakness was getting priced-in across a number of pairs, AUDUSD pushed right back up to that resistance zone, and after an opening gap-higher to start this week’s trade, sellers have come back with aggression.
Yesterday saw the build of a bearish engulfing candlestick, which will often be approached with the aim of directional continuation. Already, prices have bounced back to the .7000 big figure to find resistance.
AUDUSD Daily Price Chart

Chart prepared by James Stanley
For traders looking at bullish strategies around the US Dollar, AUDUSD will likely stand out as one of the more attractive options amongst major pairs. Continued seller defense of the resistance area around the .7000 big figure keeps the door open for bearish approaches, with targets directed to prior support zones around .6955, .6911 and then .6850.
AUDUSD Four-Hour Price Chart

Chart prepared by James Stanley
To read more:
Are you looking for longer-term analysis on the U.S. Dollar? Our DailyFX Forecasts have a section for each major currency, and we also offer a plethora of resources on Gold or USD-pairs such as EUR/USD, GBP/USD, USD/JPY, AUD/USD. Traders can also stay up with near-term positioning via our IG Client Sentiment Indicator.
Forex Trading Resources
DailyFX offers an abundance of tools, indicators and resources to help traders. For those looking for trading ideas, our IG Client Sentiment shows the positioning of retail traders with actual live trades and positions. Our trading guides bring our DailyFX Quarterly Forecasts and our Top Trading Opportunities; and our real-time news feed has intra-day interactions from the DailyFX team. And if you’re looking for real-time analysis, our DailyFX Webinars offer numerous sessions each week in which you can see how and why we’re looking at what we’re looking at.
If you’re looking for educational information, our New to FX guide is there to help new(er) traders while our Traits of Successful Traders research is built to help sharpen the skill set by focusing on risk and trade management.
--- Written by James Stanley, Strategist for DailyFX.com
Contact and follow James on Twitter: @JStanleyFX


