


Dow Tests Fibo Resistance; US Dollar Holds Support at Two Month Low
US Dollar Talking Points:
- The US Dollar opened the week by trickling down for a re-test of two month lows, testing the same prices that came-in as support in November and again last week, shortly after the open of the New Year. Thus far buyers have been able to hold the line, and this has helped USD/JPY further its recovery while EUR/USD has tilted lower from the big zone of resistance that’s been in-play for the past couple of months.
- The big question is whether the current recovery might be able to hold: US stocks have continued to trend-higher while the Yen softens after last week’s ‘melt up.’ Tomorrow brings FOMC meeting minutes from the December rate decision, and Thursday brings a speech from Chair Powell. The week closes with US CPI data set to be released on Friday morning, carrying the expectation for headline CPI to soften back-below the 2% threshold.
- DailyFX Forecasts have been published for Q1, 2019 on a variety of currencies such as the US Dollar or the Euro and are available from the DailyFX Trading Guides page. If you’re looking to improve your trading approach, check out Traits of Successful Traders. And if you’re looking for an introductory primer to the Forex market, check out our New to FX Guide.
Do you want to see how retail traders are currently trading the US Dollar? Check out our IG Client Sentiment Indicator.
US Dollar Holds Support at Two-Month Lows
The US Dollar is continuing yesterday’s bounce from support after prices tested two-month lows. This level comes in around 95.67, and this is the same area that helped to bring on bounces in early-November and again last week, shortly after the 2019 open. The big question at this point is for how long might bulls be able to retain control: Two different areas of prior Fibonacci support lurk above current price action, and these levels can remain of interest for those looking at short-side strategies in the US Dollar. The first of those areas is at 96.04, as this is the 50% marker of the 2017-2018 bullish move. And a bit higher is the 96.47 level, which is the 23.6% Fibonacci retracement of the 2011-2017 major move in the currency.
US Dollar Eight-Hour Price Chart
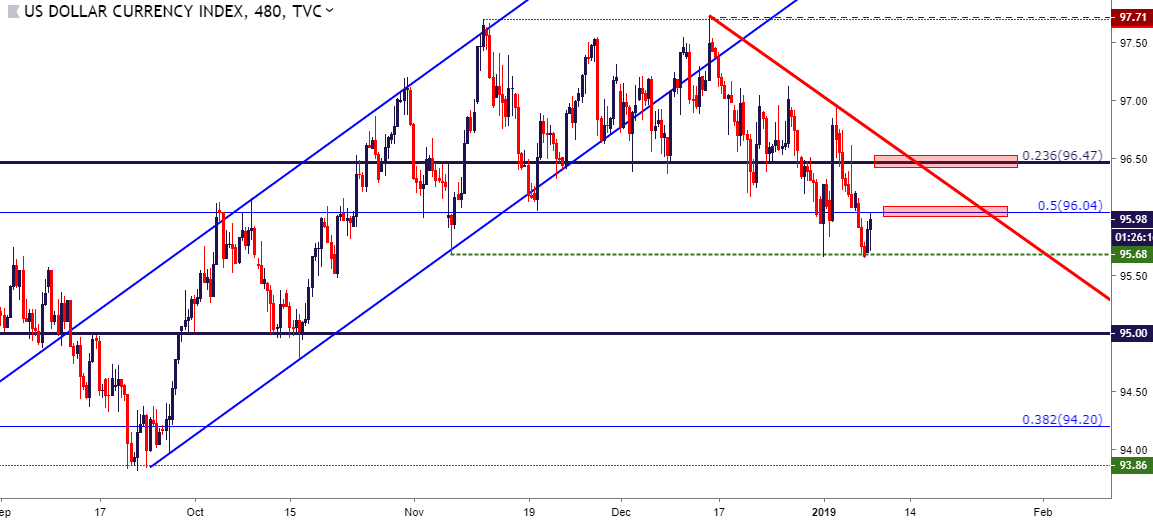
Chart prepared by James Stanley
This Week’s Economic Calendar
This week’s economic calendar is fairly light, especially in the early portion of the week. Tomorrow brings meeting minutes from the December FOMC rate hike, and Thursday brings a speech with Fed Chair, Jerome Powell. The week closes with the release of US CPI data on Friday morning, which carries the expectation for headline CPI to soften below 2%.
DailyFX Economic Calendar: High-Impact Items
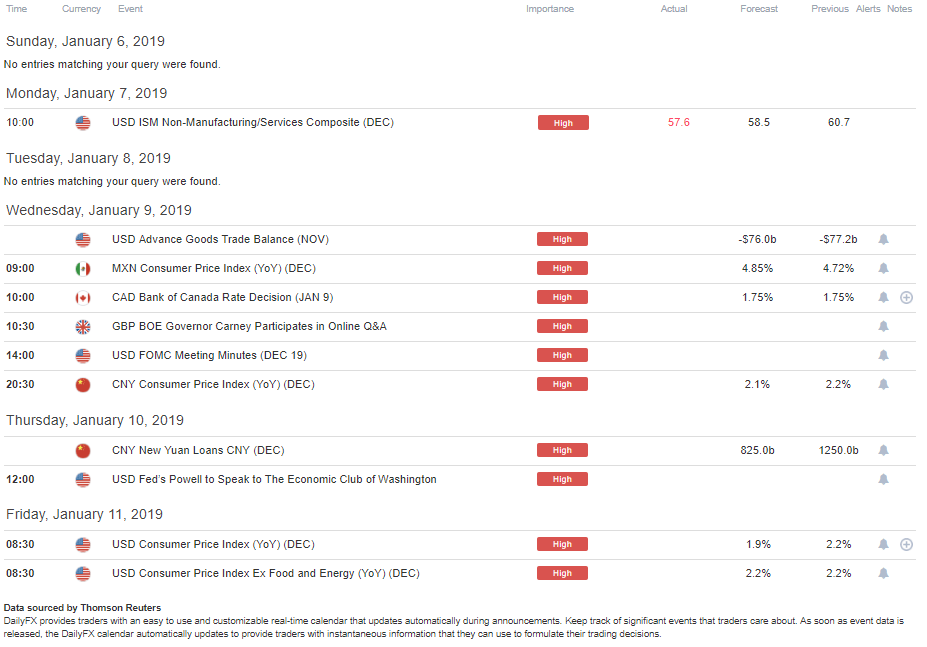
Chart prepared by James Stanley
EUR/USD Holds Resistance in Key Zone
Yesterday’s resistance test in EUR/USD has seen another swing from sellers, with prices moving back into the range that’s been present for much of the past two months. As discussed in this week’s FX Setups, a topside break over the 1.1500 level could re-open the door for bullish strategies in the pair, but, as yet, bulls have been unable to evoke such a scenario. A bit of short-term support appears to be developing around a trend-line projection taken from the April and September highs.
EUR/USD Daily Price Chart
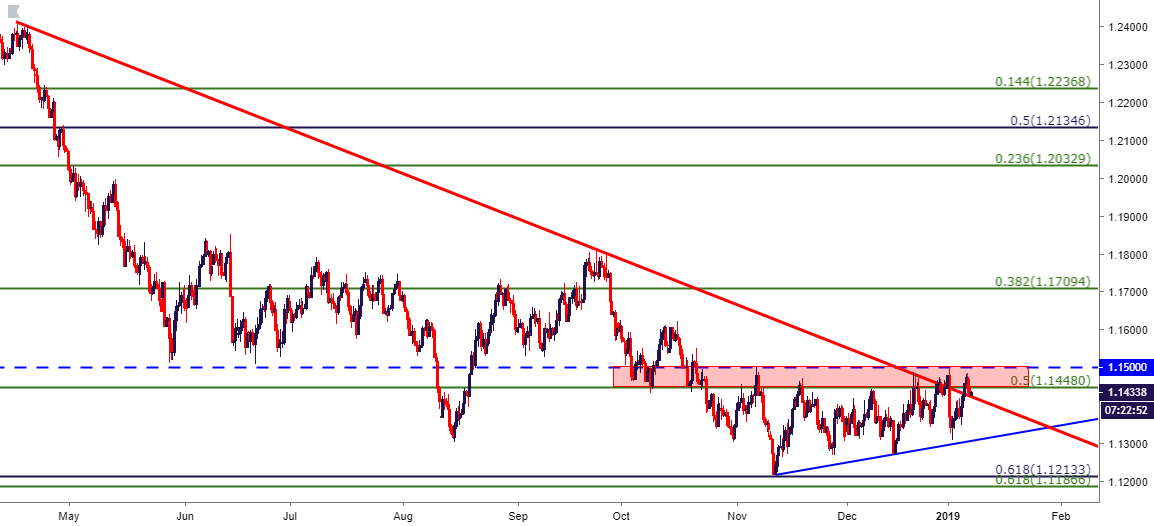
Chart prepared by James Stanley
USD/JPY Showing Short-Term Support at Prior Resistance: 110.00 Test in Store?
USD/JPY continues to recover after last week’s rather aggressive sell-off. Buyers have continued showing short-term support at prior resistance, following Monday’s hold above 108.00 with a later test of support around 108.47. This keeps the door open for a deeper test of a key zone that runs from 109.67-110.00; which could re-open the potential for bearish strategies in the pair.
USD/JPY Hourly Price Chart
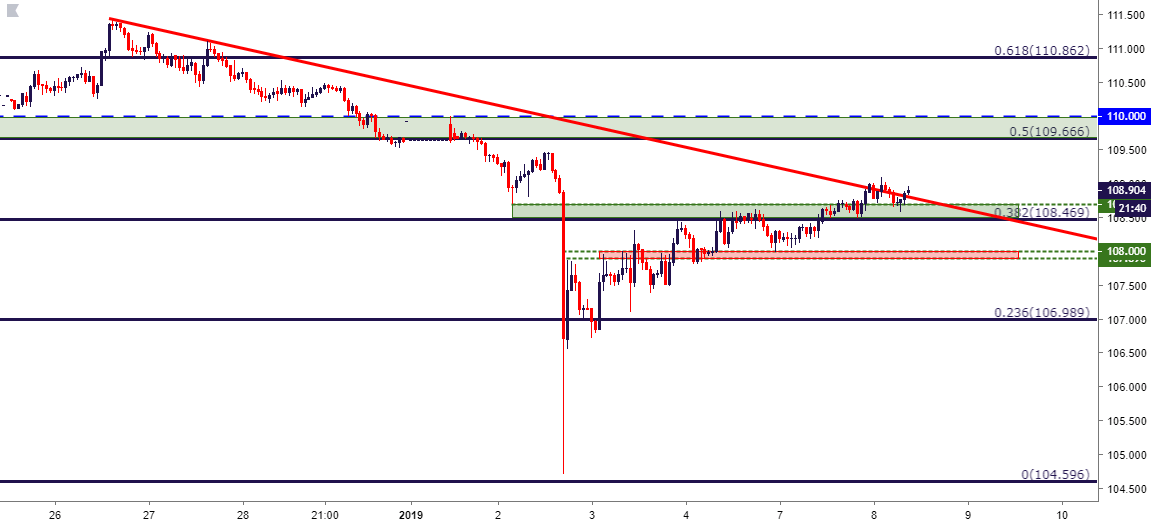
Chart prepared by James Stanley
EUR/JPY Nears Re-Test of 125.00
In a similar vein as the above two markets, EUR/JPY has continued to recover after last week’s significant short-side move. After bottoming out below the 119.00 level, buyers have continued to push and prices are nearing a re-test of the 125.00 level; which had provided two different support bounces last year after tests in May and again in August. For those looking at short-side strategies in the Euro or on the other side, bullish strategies in the Yen that wouldn’t require waiting for a re-test of the 110.00 zone on USD/JPY, this could remain a market of interest.
EUR/JPY Daily Price Chart
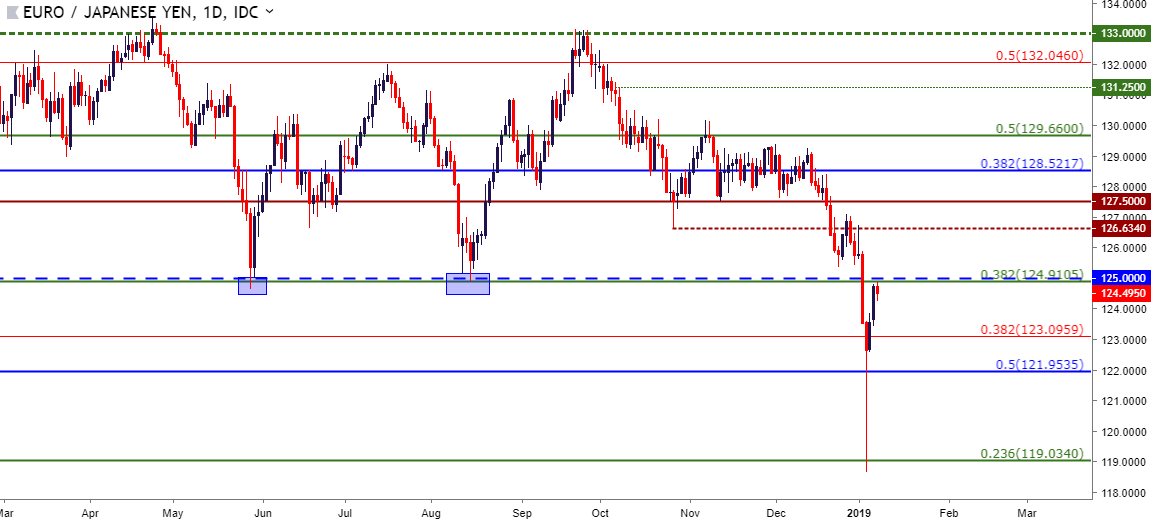
Chart prepared by James Stanley
Dow Nears Test of Key Zone: Can Bulls Continue to Push?
Of particular interest at the moment is whether US equities can continue to recover after the one-two punch of good news last Friday. Friday morning brought a blowout NFP report that was, all-in-all, a healthy showing in US employment and wage data. And a couple hours after that, Jerome Powell took a dovish tilt in commentary at an interview shared with former Fed Chairs Janet Yellen and Ben Bernanke. So, while the US economy remains in a fairly healthy spot, at least as indicated by that NFP data; a softer approach from the Fed could help to bring the bid back to US bourses after last year’s Q4 slump.
In the Dow Jones, I looked at a key area of support coming into this week around the 23,300 area, as there are two different Fibonacci levels of relevance within a rather tight range. That support helped to cauterize the low yesterday, and prices are fast approaching another Fibonacci level at 23,847, which is the 50% marker of the December sell-off.
Dow Jones Four-Hour Price Chart
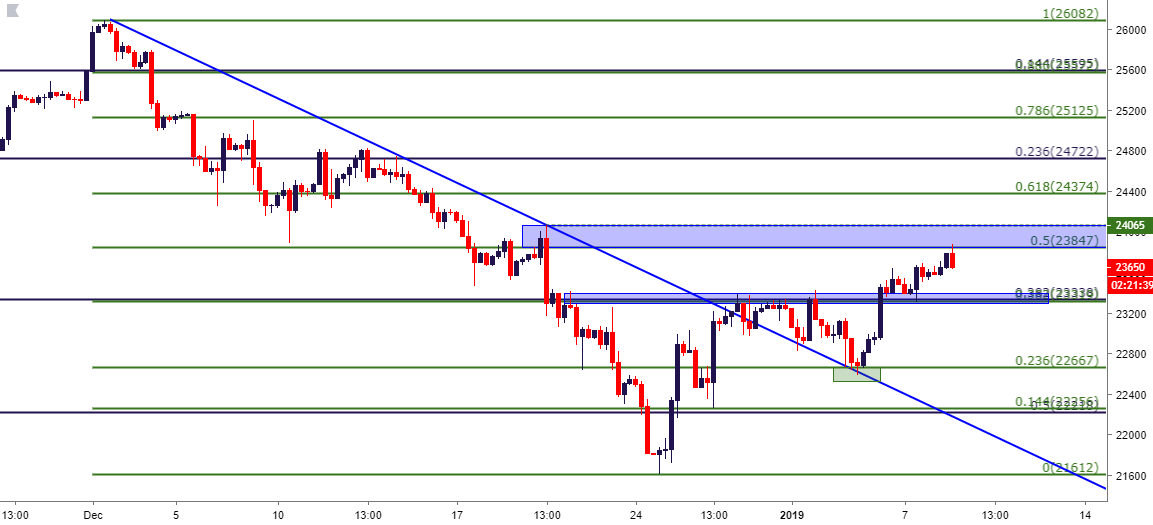
Chart prepared by James Stanley
To read more:
Are you looking for longer-term analysis on the U.S. Dollar? Our DailyFX Forecasts for Q1 have a section for each major currency, and we also offer a plethora of resources on USD-pairs such as EUR/USD, GBP/USD, USD/JPY, AUD/USD. Traders can also stay up with near-term positioning via our IG Client Sentiment Indicator.
Forex Trading Resources
DailyFX offers a plethora of tools, indicators and resources to help traders. For those looking for trading ideas, our IG Client Sentiment shows the positioning of retail traders with actual live trades and positions. Our trading guides bring our DailyFX Quarterly Forecasts and our Top Trading Opportunities; and our real-time news feed has intra-day interactions from the DailyFX team. And if you’re looking for real-time analysis, our DailyFX Webinars offer numerous sessions each week in which you can see how and why we’re looking at what we’re looking at.
If you’re looking for educational information, our New to FX guide is there to help new(er) traders while our Traits of Successful Traders research is built to help sharpen the skill set by focusing on risk and trade management.
--- Written by James Stanley, Strategist for DailyFX.com
Contact and follow James on Twitter: @JStanleyFX


