


FX Setups for the Week of January 7, 2019
- DailyFX Quarterly Forecasts have been updated for Q1, and are available directly from the following link: DailyFX Trading Guides, Q1 Forecasts.
- For trading ideas, please check out our Trading Guides. And if you’re looking for something more interactive in nature, please check out our DailyFX Live webinars.
- If you’d like more color around any of the setups below, join in our live DailyFX webinars each week, set for Tuesday and Thursday at 1PM Eastern Time. You can sign up for each of those sessions from the below link:
Tuesday: Tuesday, 1PM ET
Thursday: Thursday 1PM ET
Do you want to see how retail traders are currently trading the US Dollar? Check out our IG Client Sentiment Indicator.
Not even a full week into the New Year and already an abundance of market themes are at traders’ fingertips. The risk aversion theme that started to show in Q4 has extended into 2019, and earlier this week brought fireworks in the Yen following an after-the-bell warning from Apple. The Yen surged to fresh highs as the risk trade came under further fire, and since then there’s been a stepping back from the ledge; aided in-part by a Friday speech from Jerome Powell in which the head of the FOMC implied that the bank would be patient with future rate hikes given the recent increase in volatility. On the data front, a strong NFP report on Friday helped to offset at least a portion of the worry that came-in from the disappointing ISM numbers released the day before.
Next week brings a lighter economic calendar, so focus will likely remain on macro themes and whether the Friday risk rally might be able to continue following those supportive comments from Chair Powell. Below, I look at four different markets of interest for next week, and it’s important to note that these setups are designed for next week’s price action, as the potential for gaps over the weekend could completely change the backdrop of any of the below markets.
Bullish EUR/USD on Break Above 1.1500
I’ve been following this for the past couple of weeks and that patience has yet to pay off as EUR/USD is continuing to work within the consolidation formation that’s been brewing for a couple of months now. Support around the 1.1200 handle has continued to hold the yearly lows while the resistance zone that runs from 1.1448-1.1500 continues to hold the highs.
Inside of that consolidation, however, may be some early warning signs of an impending breakout. Higher-lows have shown of recent and this goes along with an increasing frequency of tests at resistance. This takes on the tone of an ascending triangle formation, which will often be approached from a bullish perspective, looking for the motivation that’s brought bulls in at higher-lows to lead to an eventual break of the horizontal resistance.
EUR/USD Daily Price Chart
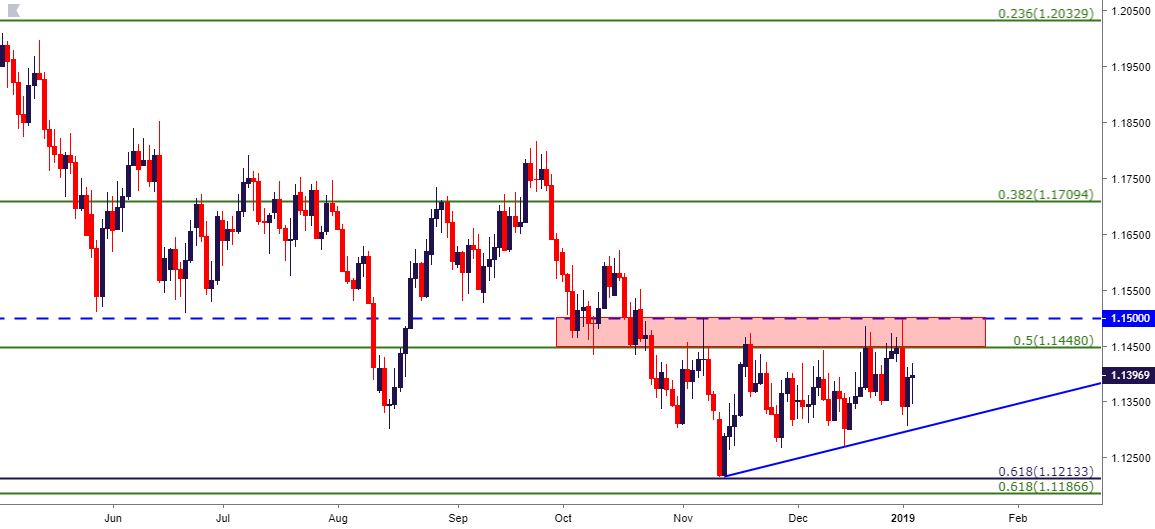
Chart prepared by James Stanley
USD/JPY Rides Bullish Trend-Line into Resistance
USD/JPY was very much in-focus to start the New Year as Yen-strength showed in a pronounced manner against practically every currency on Earth. After starting to look at the short-side of the pair a few weeks ago, sellers have taken-over to push down to fresh ten-month lows in the pair, and this week’s ‘melt up’ in the currency took on an extreme tone as prices in USD/JPY cratered below a number of support levels.
As looked at on Thursday , this move would likely lead to some element of pullback, which has continued to show. I looked at areas of resistance around 107.89-108.00, 108.47-108.70 and a bit higher on the chart at 109.67-110.00. After spending Thursday afternoon testing around 108.00, prices tip-toed higher to eventually begin testing the second area of resistance around 108.47-108.70. Since that level came into play, prices have held, but buyers haven’t yet shown any signs of letting up as indicated by a bullish trend-line that’s built in over the past couple of days. This could lead to a deeper retracement, and this sets up the resistance zone from 109.67-110.00 for resistance potential. A show of resistance in this area re-opens the door for short-side strategies in the pair.
USD/JPY Two-Hour Price Chart
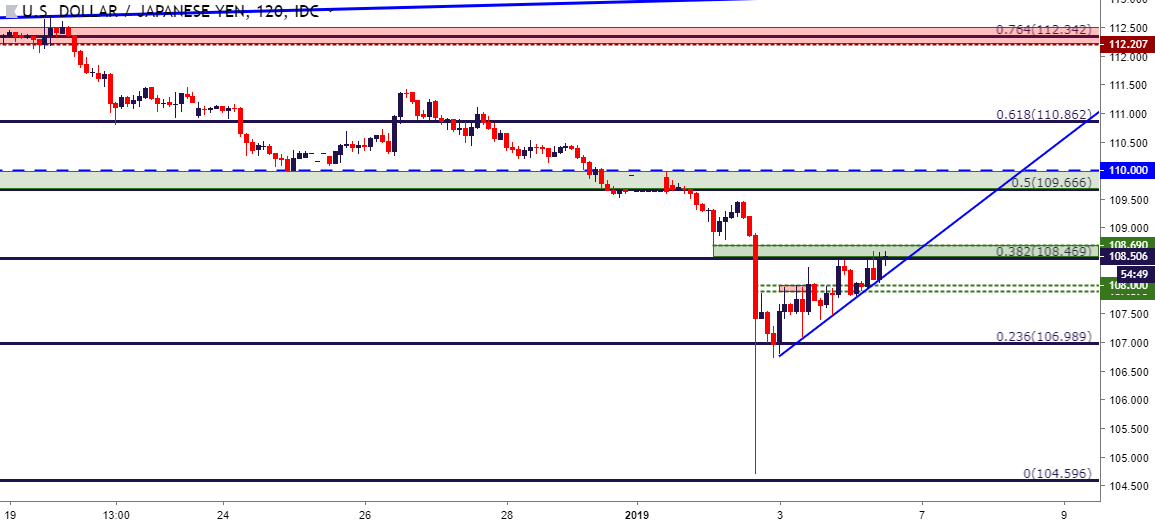
Chart prepared by James Stanley
GBP/JPY Recovery Potential Up to 139.50/140.00
In Thursday’s webinar, I had looked at recovery setups in GBP/JPY as a short-term pattern of higher-highs and higher lows had developed. Key for the setup was support showing at a prior area of near-term resistance that came-in around a key Fibonacci level at 135.87. This is the 61.8% Fibonacci retracement of the 2016-2018 major move, and this is related to the 50% marker of the same move that had previously helped to hold the yearly low in GBP/JPY.
With buyers continuing to push and prices now more than 600 pips off of this week’s low, the door may be open to continuation up to the 140.00 handle. Support showing at prior resistance of 137.00 could re-open the door to topside setups, targeting a move up to 138.50 followed by 139.40.
GBP/JPY Two-Hour Price Chart

Chart prepared by James Stanley
EUR/JPY Resistance Potential at 125.00
This is a bit longer-term than the above two JPY setups: EUR/JPY kicked off 2019 by plunging through a big level of support at 125.00. This price had given two different support bounces in 2018, helping to hold the yearly low on the pair; and a third touch of this zone was met by a vacuum in price action as prices fell all the way below the 119.00 handle, albeit temporarily.
Matters still appear a bit less directional on short-term charts, but if prices can move back up to this price of 125.00 to find sellers, the door could soon re-open to bearish continuation strategies. This was my Top Trade for 2019, and the potential for bearish drive remains. Should resistance show at 125.00, initial targets could be investigated at 123.10, 121.95 and again at 120.00 for a re-test of lower psychological level.
EUR/JPY Daily Price Chart
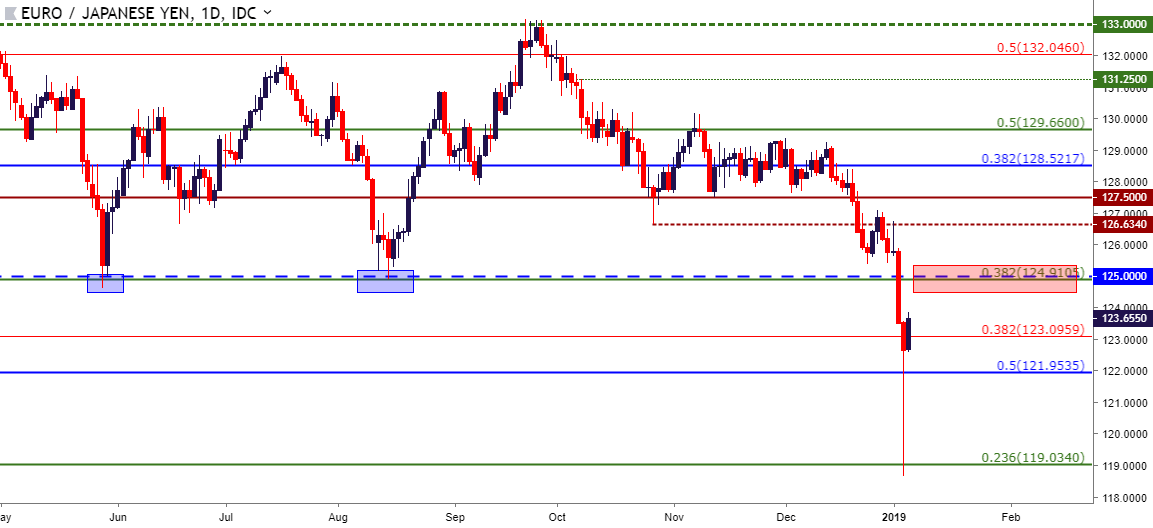
Chart prepared by James Stanley
To read more:
Are you looking for longer-term analysis on the U.S. Dollar? Our DailyFX Forecasts for Q4 have a section for each major currency, and we also offer a plethora of resources on USD-pairs such as EUR/USD, GBP/USD, USD/JPY, AUD/USD. Traders can also stay up with near-term positioning via our IG Client Sentiment Indicator.
Forex Trading Resources
DailyFX offers a plethora of tools, indicators and resources to help traders. For those looking for trading ideas, our IG Client Sentiment shows the positioning of retail traders with actual live trades and positions. Our trading guides bring our DailyFX Quarterly Forecasts and our Top Trading Opportunities; and our real-time news feed has intra-day interactions from the DailyFX team. And if you’re looking for real-time analysis, our DailyFX Webinars offer numerous sessions each week in which you can see how and why we’re looking at what we’re looking at.
If you’re looking for educational information, our New to FX guide is there to help new(er) traders while our Traits of Successful Traders research is built to help sharpen the skill set by focusing on risk and trade management.
--- Written by James Stanley, Strategist for DailyFX.com
Contact and follow James on Twitter: @JStanleyFX


