


US Dollar, EUR/USD Talking Points:
- The US Dollar is continuing the Friday fall and making a fast approach towards a key area of support. A strong NFP report on Friday morning initially opened the door for USD-strength, but that was reversed on the heels of some dovish comments from FOMC Chair, Jerome Powell. Both of those drivers appeared to be risk-positive for US equities, however, as a gap-higher at the open continued to run through that commentary. The big question, at this point, is whether recovery can continue after Chair Powell spoke to one of the major pressure points in the market of future FOMC rate policy.
- EUR/USD has moved back-up for a test of the resistance zone that’s been in play for the past couple of months, and the bottom of this zone at 1.1448 is derived from the 50% marker of the 2017-2018 bullish move in the pair. As discussed in this week’s FX Setups, EUR/USD climbing above the 1.1500 level can re-open the door for bullish strategies in the pair; and for those looking at strategies of weakness around the single currency, EUR/JPY is making a fast approach towards a key level of prior support at 125.00, and sellers showing resistance here can re-open the door for bearish strategies in the pair.
- DailyFX Forecasts have been published for Q1, 2019 on a variety of currencies such as the US Dollar or the Euro and are available from the DailyFX Trading Guides page. If you’re looking to improve your trading approach, check out Traits of Successful Traders. And if you’re looking for an introductory primer to the Forex market, check out our New to FX Guide.
Do you want to see how retail traders are currently trading the US Dollar? Check out our IG Client Sentiment Indicator.
US Dollar Falls Further as EUR/USD Begins Re-Test of Key Resistance Zone
The US Dollar has continued the Friday fall, and prices are making a fast approach towards a key area of support around the 95.68 level. This is the same price that helped to hold the lows in early-November and again last week; with last week’s test leading into a very bullish day of price action in the currency on Wednesday. But as discussed in the Thursday webinar, prices making a lower-high before turning back-below the key Fibonacci level of 96.47 kept the door open for strategies of weakness in the US Dollar. This theme extended on Friday after USD strength from a very strong NFP report was reversed on the heels of comments from FOMC Chair, Jerome Powell.
US Dollar Four-Hour Price Chart
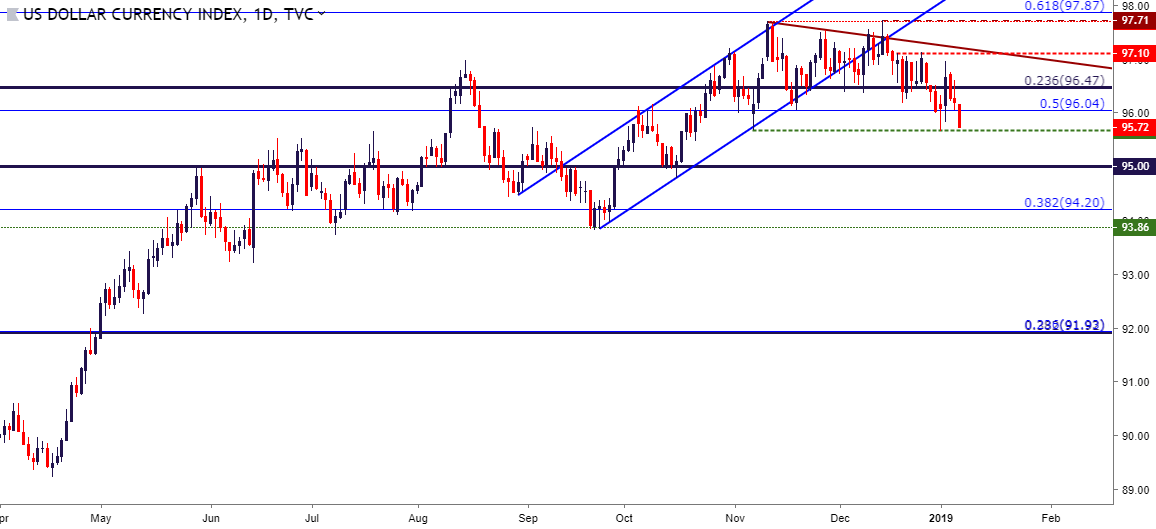
Chart prepared by James Stanley
The big question for this week is whether the Friday risk rally holds. Both above-mentioned drivers from last week, the strong NFP report and Chair Powell’s comments, appeared to have a positive impact on the risk trade, with US stocks gapping-higher at the Friday open and not looking back. In the Dow Jones, this entailed a move above a key area of confluent resistance, showing around the 23,300 level on the charts; and if price action can substantiate higher-low support around this prior zone of resistance, the door remains open for a move back towards the 24k level on the Dow. The next area of resistance on the chart would run from the 50% retracement of the December sell-off at 23,847 up to that 24k area.
Dow Jones Four-Hour Price Chart

Chart prepared by James Stanley
EUR/USD Begins Test of Key Resistance Zone
For the past couple of months, EUR/USD has been showing varying forms of consolidation. This comes after a rough six-month patch that saw almost 61.8% of the pair’s prior bullish trend erased as fears around Italy were getting priced-in to the market. And while much of the world’s attention was on the Fed and risk markets in the month of December, a couple of positive developments showed in the Euro-Zone: A détente was reached in the ongoing budget clash between Italy and Brussels, and the European Central Bank announced an end to bond buying as part of their QE program.
This has helped the pair to build in a series of higher-lows within that consolidation, and of recent, the frequency of resistance tests at the key zone of 1.1448-1.1500 has been increasing, indicating that bulls may soon be able to break-through to the other side. As discussed in this week’s FX Setups, a topside break through 1.1500 could soon re-open the door to bullish strategies in the pair.
EUR/USD Daily Price Chart

Chart prepared by James Stanley
USD/JPY Consolidates After Last Week’s Plunge
After the excitement of last week, prices in USD/JPY are narrowing between support and resistance. Support is holding around the 108.00 level while resistance remains around 108.47, which is the 38.2% retracement of the March-May 2018 major move. This same Fibonacci study has produced a number of recent support and resistance inflections, and this can keep focus on the zone that runs from 109.67-110.00 as that next area for sellers to offer resistance.
USD/JPY Hourly Price Chart
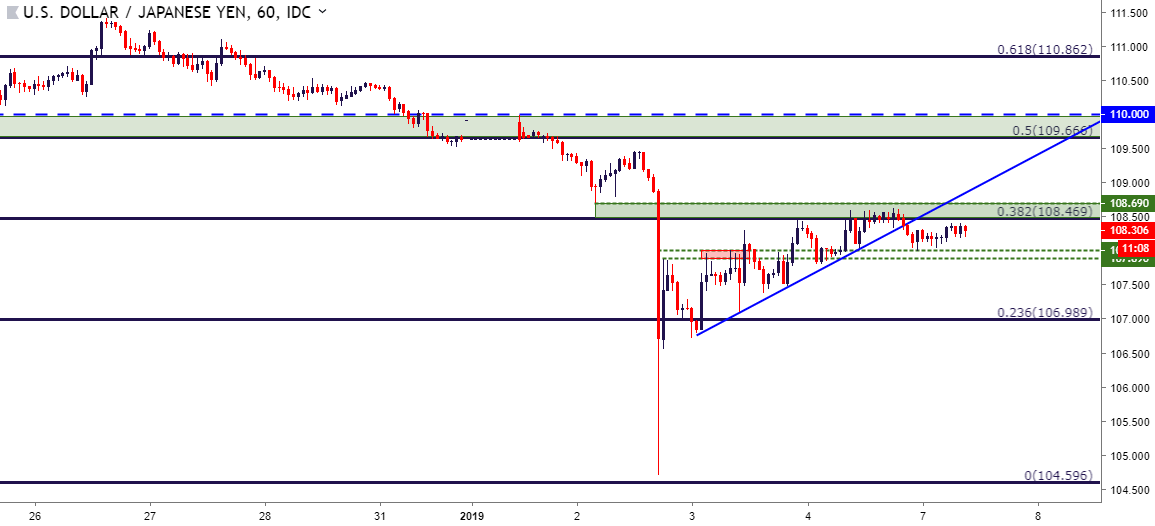
Chart prepared by James Stanley
To read more:
Are you looking for longer-term analysis on the U.S. Dollar? Our DailyFX Forecasts for Q1 have a section for each major currency, and we also offer a plethora of resources on USD-pairs such as EUR/USD, GBP/USD, USD/JPY, AUD/USD. Traders can also stay up with near-term positioning via our IG Client Sentiment Indicator.
Forex Trading Resources
DailyFX offers a plethora of tools, indicators and resources to help traders. For those looking for trading ideas, our IG Client Sentiment shows the positioning of retail traders with actual live trades and positions. Our trading guides bring our DailyFX Quarterly Forecasts and our Top Trading Opportunities; and our real-time news feed has intra-day interactions from the DailyFX team. And if you’re looking for real-time analysis, our DailyFX Webinars offer numerous sessions each week in which you can see how and why we’re looking at what we’re looking at.
If you’re looking for educational information, our New to FX guide is there to help new(er) traders while our Traits of Successful Traders research is built to help sharpen the skill set by focusing on risk and trade management.
--- Written by James Stanley, Strategist for DailyFX.com
Contact and follow James on Twitter: @JStanleyFX


